Update: How many credits would go out-of-state if Washington implemented an LCFS?
Link to article: https://stillwaterassociates.com/updated-washington-low-carbon-fuel-standard-analysis/
December 18, 2020
by Jim Mladenik
A previous Stillwater analysis determined that roughly 75% of credits in Oregon’s Clean Fuels Program (CFP) and California’s Low Carbon Fuel Standard (LCFS) programs are derived from fuels produced outside of those states. The same analysis suggested that a similar trend is likely for Washington state should it adopt an LCFS-style program. In the analysis presented in this update, Stillwater creates a plausible scenario for what volumes of alternate fuels could be used to meet an LCFS in Washington state that has a 5% reduction in carbon intensity (CI) in calendar year 2025.
Without a detailed analysis of alternative fuel use in Washington, we made the simplifying assumption that the Washington pool of fuels is similar to that in Oregon before the adoption of the CFP. The one exception to this assumption is regarding biodiesel (BD); Oregon had a B5 (5% biodiesel blending) mandate in place prior to adoption of the CFP which differentiates it from Washington state. In Oregon, prior to the introduction of the CFP, the use of LPG, CNG, LNG, BD, and electricity was much smaller than that of gasoline, ethanol, and diesel. We assumed the same for Washington state. It was also assumed that:
- Washington state’s baseline is structured as it is in California with E10 (10% ethanol blended in all gasoline) and B0 (no BD or RD) in the baseline for the gasoline and diesel pools, respectively.
- Fuel demand in Washington remains constant through 2025.
- LCFS compliance is achieved by blending lower CI ethanol, electrification of 0.5% of the gasoline pool on an energy-use basis, as well as 5% BD blending and 12% renewable diesel (RD) blending (on an energy-use basis) in the diesel pool. (For context, California and Oregon are currently at about 0.8% and 0.2% levels of electrification on an energy basis in their gasoline pools, respectively).
The results of the simulation are summarized in Table 1, which shows 28% of the 3 million credits needed for a 5% CI reduction in Washington state in calendar year 2025 are produced from ethanol, 15% from fleet electrification, and 57% from BD and RD. In this scenario, more than half of the credits are generated by 9 thousand barrels per day (KBD) of RD+BD, which is reasonable given the numerous recently announced RD projects in the U.S.
We assume all of the electricity and none of the ethanol used to generate credits are produced in-state. We also assume that the in-state BD facilities supply 75% of the BD required (3.2 KBD out of 4.3 KBD total), and that 50% of the RD from BP’s Cherry Point facility (1.3 KBD out of 2.6 KBD produced) is supplied into Washington with the rest used in Oregon and California.
Table 1: Simulation Results for a 5% CI Reduction LCFS in Washington
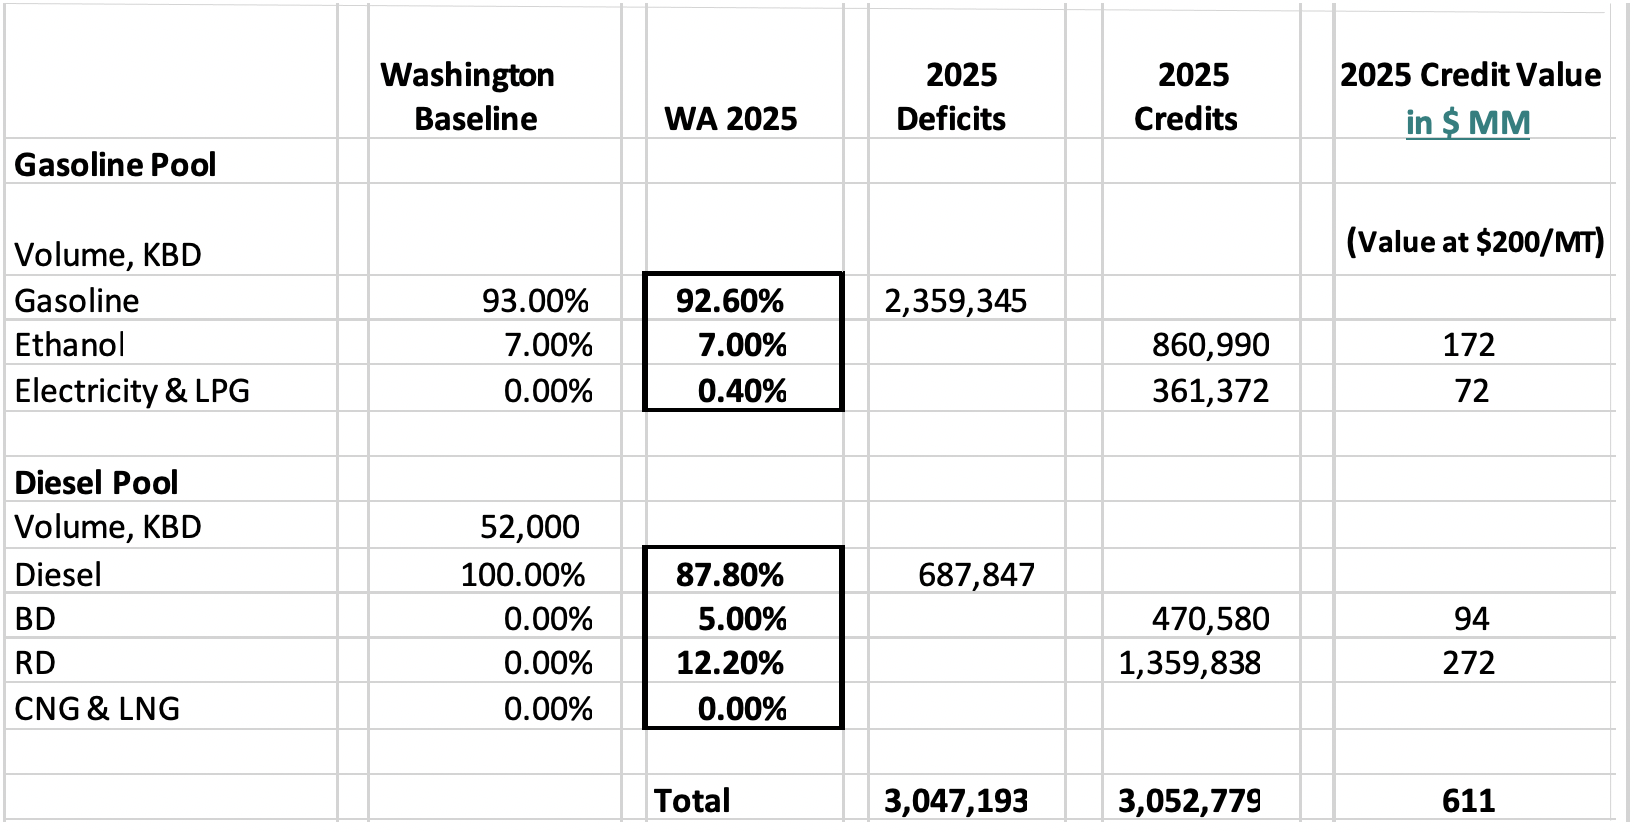
With these assumptions, we calculate that 71% of all credits (over 1.8 million MT) are generated from fuels produced outside of Washington state. About 80% of credits from liquid fuels (ethanol, BD and RD) would be earned out of state. If the range in credit prices is $150 to $200 per metric ton, these credits are valued between $325 million and $433 million per year. Calculations of these values are laid out in Table 2 below.
Table 2: Value of Credits Generated from Fuels Produced Outside of Washington

Two caveats to the above analysis:
- In-state BD and RD producers will be incentivized to sell their products in the states that optimize their business performance. The more established CFP and LCFS programs may have higher credit prices than Washington’s program, which could attract a larger fraction of these Washington-produced low-carbon fuels. Even though the assumptions here are reasonable, they should not be viewed as a forecast. It is better to think of these as estimates from an “illustrative scenario.”
- Credit prices could be higher or lower than the assumed range. If RD production increases more than demand, these prices could fall. Likewise, if RD production fails to materialize sufficiently to keep up with demand, prices could rise above the assumed range.
Notes and Assumptions
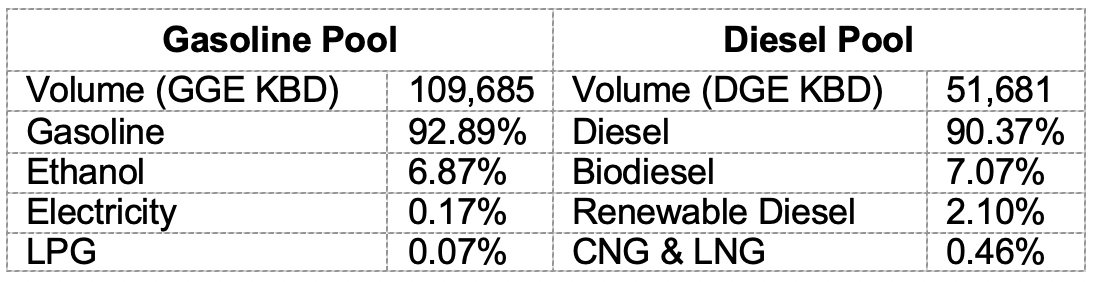
Total demand in Washington state is about 188 KBD of gasoline and 80 KBD of diesel. Oregon demand is about 110 KBD in gasoline gallon equivalents (GGE) in the gasoline pool and 52 KBD in diesel gallon equivalents (DGE) in the diesel pool for all transport fuels regulated by CFP.
If Washington had an LCFS in place, an aggressive CI-reduction schedule could result in a 5% CI reduction by 2025. Oregon is currently at 1.5% and is scheduled to be at 10% in 2025. California is currently at 7.5% and is scheduled to increase by 1.25% per year, achieving a 13.75% reduction in 2025.
In 2019, the Oregon gasoline and diesel pools looked like this:
- We assume the Washington state gasoline pool is 93% gasoline and 7% ethanol by energy (roughly E10) and that the diesel pool is 100% diesel.
- We assume the Washington baseline for LCFS calculations is E10 and B0, as in California.
- California was at a 5% CI reduction in 2018. In that year, the California gasoline pool was 92.1% gasoline, 7.3% ethanol, and 0.62% electricity by energy content; the diesel pool was 82% diesel, 14% BD+RD, and 4% CNG/LNG.
- We assume Washington meets a 5% CI reduction by growing EVs and a combination of RD+BD, and that growth in CNG, LNG, and LPG is negligible.
- We assume EVs consume 0.4% of gasoline pool energy. (Oregon was at 0.17% in 2019, and California was at 0.62% in 2018.)
- California credit prices averaged $168/MT in 2018 with a 5% CI reduction. Oregon credit prices averaged $148/MT at a 1.5% CI reduction, which is much higher than observed in California at the same reduction standard due to competition with California. We assume Washington state credit prices range from $150 to $200/MT in 2025.
All ethanol in Washington (19 KBD actual, 13 KBD GGE) comes from out of state. The BD+RD totals about 14 KBD in our 2025 simulation. We assume that BD increases to B5 statewide (4 KBD) and RD makes up the rest (10 KBD). In-state BD capacity is 7.3 KBD from two facilities, and RD capacity is 2.6 KBD from Cherry Point. California and Oregon have more mature programs so that credits are likely to be more valuable there, incentivizing most Washington state production to continue to be moved into those states. We assume that Washington provides 75% of Washington BD (3.2 KBD) and 50% of RD stays in Washington (1.3 KBD), so total supply in-state is 4.5 KBD. As such, more than 9.5 KBD of BD and RD would come from out of state, roughly 70% of the total BD and RD consumed in Washington in this simulation.
Tags: CFS, Clean Fuel Standard, LCFS, Low Carbon Fuel Standard, Washington, Washington state