West Coast LCFS Credits Generated by Fuels Produced Out-of-State
Link to article: https://stillwaterassociates.com/west-coast-lcfs-credits-generated-by-fuels-produced-out-of-state/
October 20, 2020
by Jim Mladenik
Summary
California’s Low Carbon Fuel Standard (LCFS) and Oregon’s Clean Fuel Program (CFP) are designed to provide significant financial incentives for the production and blending of low-carbon fuels into the states’ transportation fuels systems. These incentives can be large enough to spur development of numerous projects to reduce the carbon intensity (CI) of ethanol, manufacture renewable diesel, and attract the lowest CI biodiesel into California and Oregon. However, because the most efficient places to produce these fuels are not necessarily in the states with the regulations, the majority of credits from low-carbon fuel production is attributed to fuels produced outside of California and Oregon. Stillwater estimates that nearly 75% of all credits generated in both states are from fuels brought in from other states or countries. The value of these credits from fuels produced out-of-state in 2019 was more than $2.1 billion in California and nearly $140 million in Oregon. If the state of Washington adopts an LCFS program, Stillwater expects the majority of credit-generating, low-carbon fuels to be produced outside of the state because of its similarity to California and Oregon.
California Analysis
In 2019, the five major sources of LCFS credits were (in order from most to least) renewable diesel, ethanol, electricity, biodiesel, and renewable natural gas. The California Air Resources Board (CARB) compiles and presents on its LCFS data dashboard volumes of alternative liquid fuels (renewable diesel, ethanol, and biodiesel) produced in-state since the inception of the LCFS program in 2011. Those volumes are listed in Table 1 below.
Table 1. Share of LCFS Liquid Biofuel Volume Produced in State of California
The portion of credit-generating fuels produced in-state varied from 11% to 14.6% over the life of the program and was nearly flat at about 13.5% over the past two years. CARB’s LCFS data dashboard also publishes the graph shown below as Figure 1 to detail more precisely what the in-state fraction is for each of the three types of fuels.
Figure 1. Share of Liquid Biofuels Produced In-State by volume in 2018
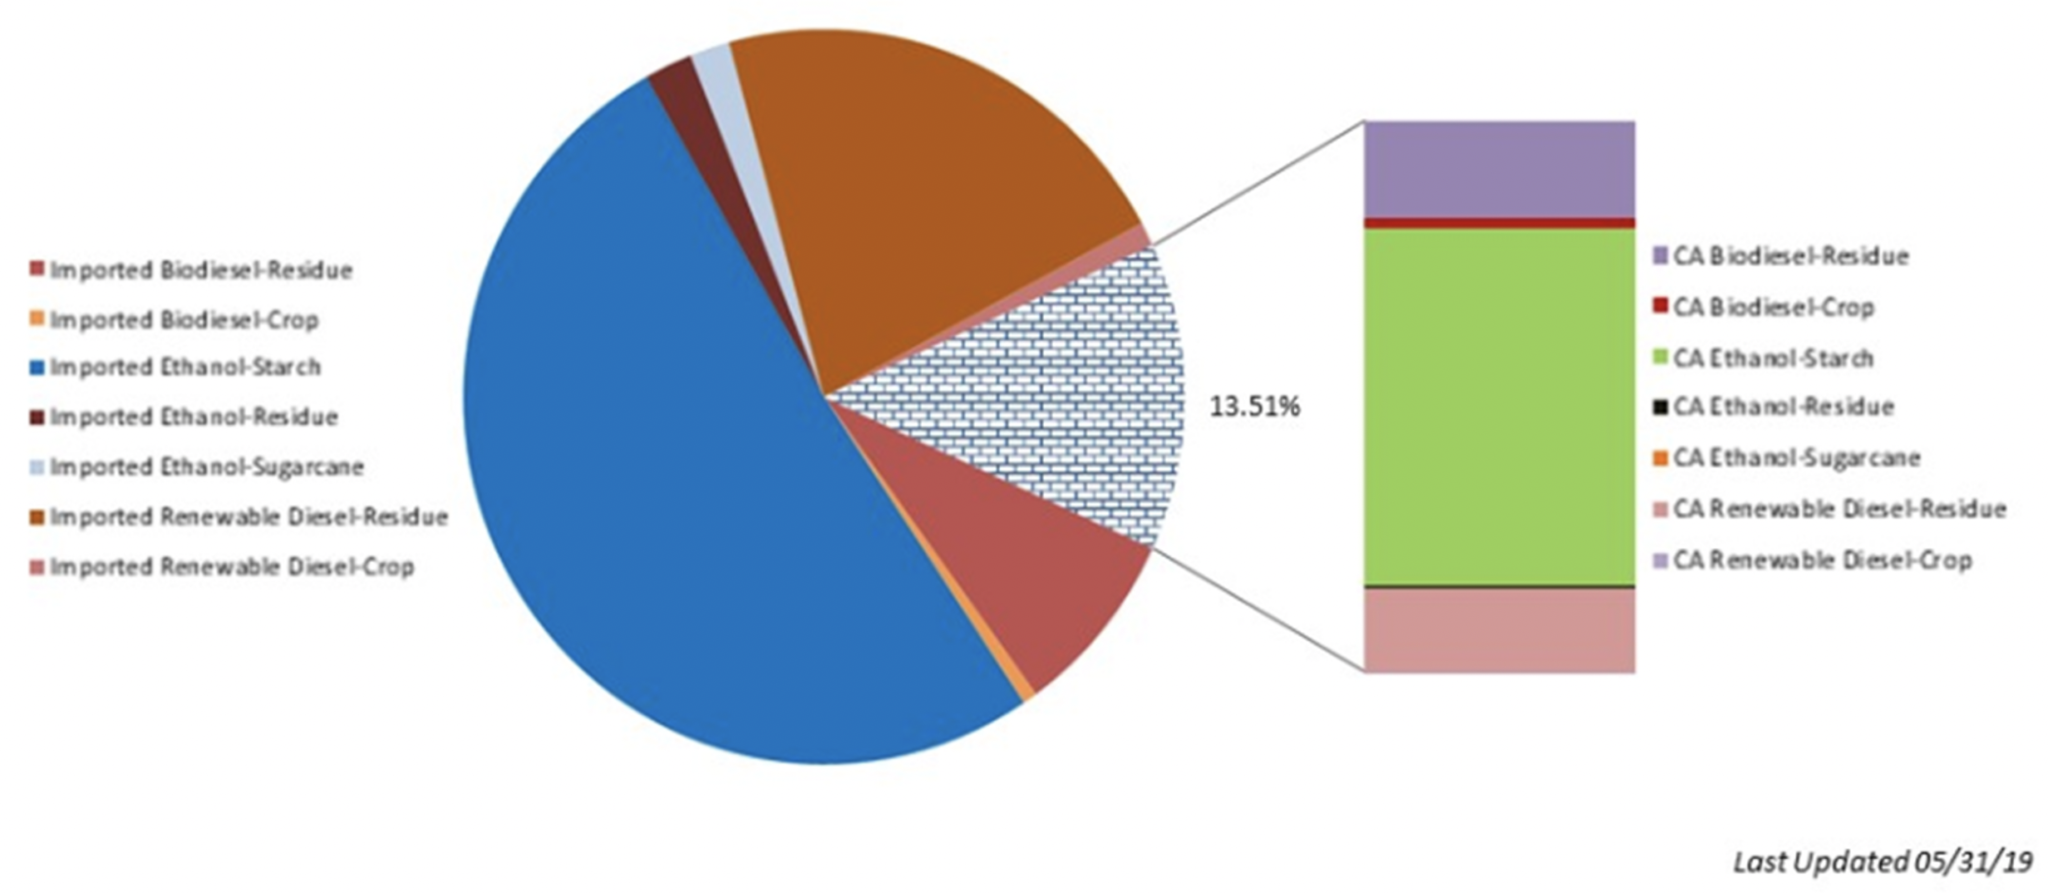
From this chart, Stillwater estimates that 86% of ethanol, 90% of renewable diesel, and 78% of biodiesel consumed in California in 2018 was produced out-of-state.
Estimating out-of-state production for non-liquid fuels is more difficult. For renewable natural gas, Stillwater very roughly estimated the imported RNG fraction based on the number of approved pathways published by CARB for out-of-state versus in-state locations and adjusted it down slightly. Using this assumption, we estimate that about 80% of the RNG generating credits for LCFS is imported from out-of-state.
Determining credits generated from imported electricity is also complicated. Data published by the California Energy Commission (CEC) show that 31% of the power consumed in-state is renewable and that about 30% of the renewable power consumed is imported, so we will use 30% for this analysis but qualify what this means later.
Using 2018 values for liquid biofuels, the specific assumptions described above for RNG and electricity, the average LCFS credit price in 2019 ($197/MT), and Stillwater analysis of quarterly LCFS program data published by CARB for 2019, the value of LCFS credits generated by fuels produced out-of-state totals approximately $2.1 billion, as shown in Table 2.
Table 2. Estimate of LCFS Credit Value from Fuels Produced Outside of California
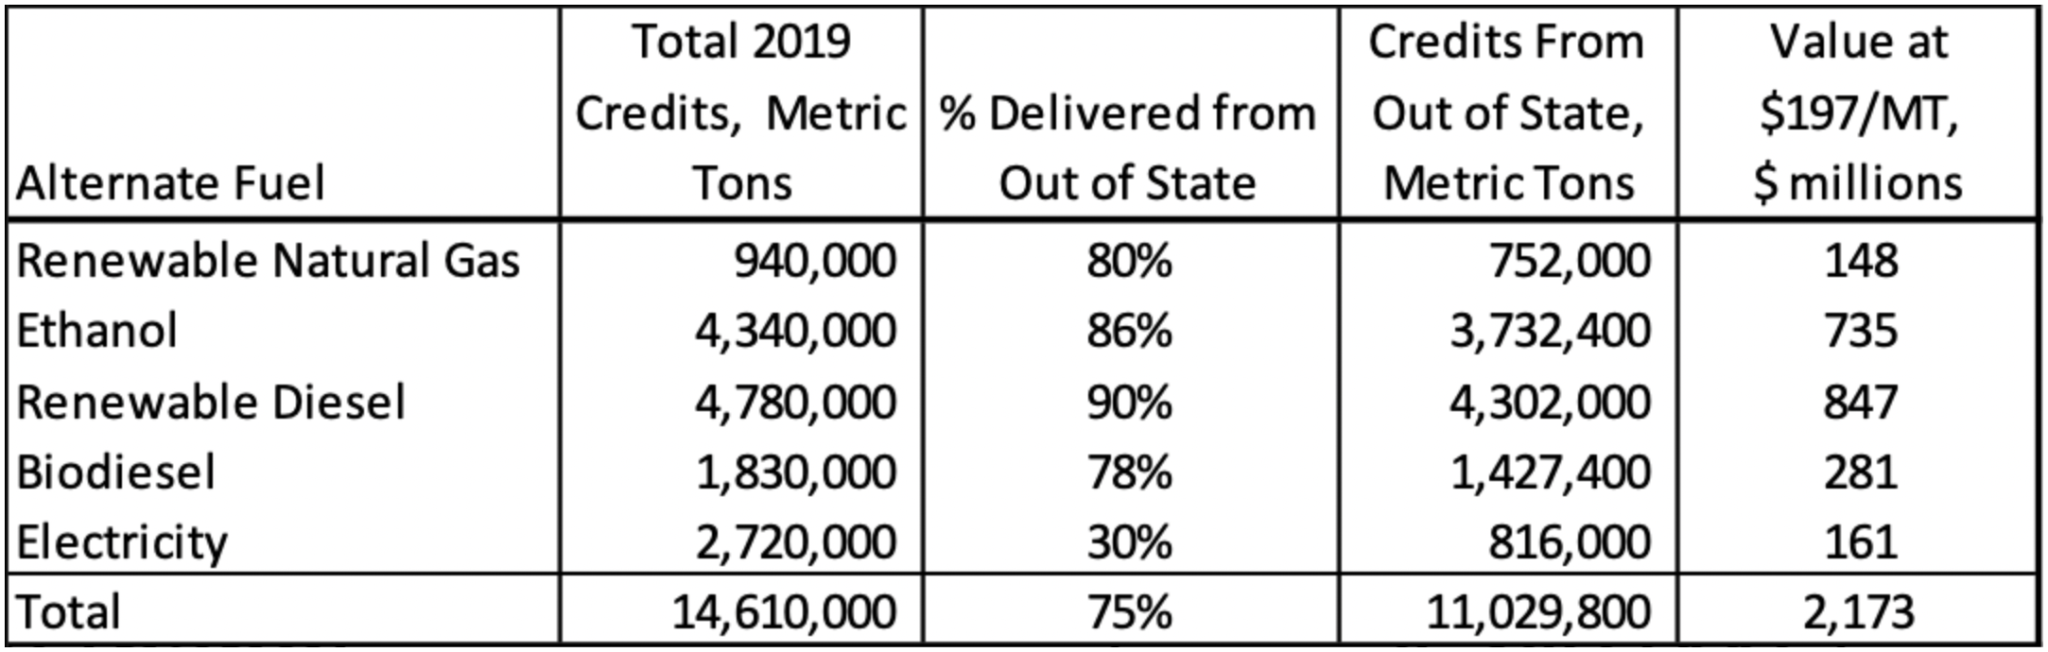
We estimate that 75% of the credits generated under the LCFS program are from fuels brought in from other states or countries. These fuels are produced outside of California. This represents about $2 billion of value in 2019. Some of this value for liquid products and RNG is shared as the fuel is transferred through the production, transport, and sales steps in the supply chain within the state. In order to capture nearly all of this value, an out of state manufacturer would need to transport the fuel to California and then distribute and sell it directly into vehicles. Only a few very large out of state producers participate in the California market in this way. For electricity, a number of non-LCFS incentives are in place to encourage the development of renewable (and, therefore, low-CI) power which has a higher value in the national power market. Overall, a lower percentage of LCFS credits from electricity is from out of state production than for other alternative fuel sources.
Oregon Analysis
Four categories of low-carbon fuels – ethanol, renewable diesel, biodiesel, and electricity – generated 98% of the credits reported in Oregon’s Clean Fuels Program (CFP) in 2019. Just two of these – ethanol and biodiesel – created 78% of all credits in the program. The quantity of each of these fuels produced out-of-state are estimated as described below:
- In 2018, 70% of Oregon’s utility-scale net electricity production came from conventional hydroelectric power plants and other renewable resources. Wind farms produced 12% of Oregon’s net generation, and Oregon was a net exporter of electricity in 2018. Therefore, none of the electricity provided into vehicles was imported from out-of-state.
- All the renewable diesel consumed in Oregon is from out-of-state since there are no operating RD production facilities in the state.
- In 2019, 60 million gallons of biodiesel were consumed in Oregon according to CFP quarterly data released by the Oregon Department of Environmental Quality (DEQ). There is a one biodiesel production facility in the state, with a total production capacity of 17 million gallons per year. If the plant operates with a 90% on-stream efficiency, in-state production would be about 25% of consumption. As such, we assume 75% of supply is from out of state.
- In 2019, 166 million gallons of ethanol were blended in Oregon according to CFP quarterly data released by DEQ. There is one ethanol production facility in Oregon with a capacity to produce 37.5 million gallons per year. If the plant operates with a 90% on-stream efficiency, in-state production would be about 20% of consumption. As such, we assume 80% of ethanol supply is from out of state.
Applying these estimates to the DEQ report of quarterly CFP data yields a summary of the value of CFP credits to out of state fuel producers at the 2019 average credit price of $148/MT which is shown below as Table 3.
Table 3. Estimate of CFP Credit Value from Fuels Produced Outside of Oregon

Overall, about 74% of all credits generated in the CFP have been generated from liquid biofuels produced out of state. The value of these credits was about $137 million in 2019, but we note that, similar to LCFS credits, suppliers do not necessarily capture all this value unless they participate in the fuel value chain through supply and sales to end-users. This compares to the total value of CFP credits generated in 2019 of almost $188 million.
Washington State Assessment
Washington has a transportation fuel market almost twice the size of Oregon and about one-fourth the size of California. LCFS-style programs have been proposed several times at the state level in Washington, but none have been enacted yet. If Washington state were to adopt an LCFS, it is likely to generate credits from low-carbon fuels in similar ways to the existing West Coast programs. There are several potential sources of credits from liquid fuels produced in-state:
- Two biodiesel plants with a total production capacity of 112 million gallons per year (or 7.3 thousand barrels per day), and
- A 40 million gallon per year (or 2.6 thousand barrels per day) renewable diesel production facility via co-processing owned by BP at Cherry Point.
Production from these two facilities is transported to California and Oregon to capture the incremental value from LCFS and CFP credits. Washington has no in-state ethanol production facilities. Potential credit generation from electric, CNG (Compressed Natural Gas), LNG (Liquified Natural Gas), and LPG (Liquified Petroleum Gas) vehicles is quite small. Electricity generation for the state of Washington is similar to Oregon, and Washington is second only to California in electric vehicle (EV) ownership. However, the EV ownership rate in Washington state is still less than half of that of California. In addition, CNG-, LNG-, and LPG-powered vehicles in the state of Washington numbered 304, 64, and 37, respectively in 2017 according to the EIA. Like Oregon, the use of these alternate fuels in Washington state is not likely to significantly contribute to LCFS credit generation for a long time. Overall, this evidence supports Stillwater’s view that the majority of credits that would be supplied into a Washington LCFS program would be generated by fuels produced out of state, as has been the case in Oregon and California.
Conclusion
In general, we find that most of the alternative fuels generating credits for the two West Coast low-carbon fuels programs are manufactured outside of the programs’ jurisdictions. This is a logical market response to the regulations as they financially incentivize the sale of low-carbon fuels into these markets while the most efficient places to produce these fuels are not typically on the West Coast, and transportation costs to deliver the fuels into these states is a small fraction of their value. Given that Washington has similar disadvantages to producing low-carbon liquid fuels that exist in California and Oregon, we find that this conclusion is likely to apply to Washington State if an LCFS is adopted there.