A Look at Oregon’s First Credit Clearance Market
Link to article: https://stillwaterassociates.com/a-look-at-oregons-first-credit-clearance-market/
June 20, 2019
By Jim Mladenik
On May 31st, the Oregon Department of Environmental Quality (DEQ) issued a statement explaining the need for a Credit Clearance Market (CCM) to enable deficit holders in the Clean Fuels Program (CFP) to balance their accounts for the 2018 calendar year. Six entities (ARS Fresno, Conrad & Bischoff, Costco, Pilot, Pounder Oil Service, and Tyree Oil) ended the year with a net combined total of 8,056 MT in deficits. This represents less than 1% of the nearly 900,000 deficits or 978,000 credits generated in 2018. The six entities generated deficits as regulated importers of gasoline and/or diesel and had until the end of April of 2019 to balance their 2018 accounts to avoid being automatically entered into the CCM. Four parties (BP, McCall, Portland General Electric, and SeQuential Biodiesel) pledged a total of 54,000 credits into the CCM – more credits than necessary to cover the total of deficits. As such, all six deficit holders are required to fully cover their 2018 deficits through credit purchases in the CCM.
Oregon’s first-ever CCM seems to differ from the first CCM held by the California Air Resources Board (CARB) under the Low Carbon Fuel Standard (LCFS) in 2016 to enable a single entity (Astra Oil) to balance its small net deficit for 2015. At that time, three parties pledged more than sufficient credits to meet Astra’s shortfall. The 2016 California CCM appeared to be a “test run” to demonstrate how it would work. This year’s Oregon CCM, with six deficit-holding entities participating, appears to be less of a test run and more of a necessity. Table 1 below compares credit balances in the two markets for the year in which each had its first CCM.
Table 1. LCFS and CFP Credit Balances in Years with CCM

While both markets had credits generated in excess of deficits, the California market’s excess in 2015 was proportionally eleven times larger than that of Oregon in 2018, which indicates a much tighter market. In addition, as noted in prior Stillwater commentaries, the credit bank accumulated in the first few years of the California program was much larger than observed in the CFP. This is due to a combination of Oregon’s competition with the established California market for low carbon alternative fuels and a lower carbon intensity baseline in Oregon’s diesel pool which contained 5% biodiesel.
Table 1 also lists total credits traded during the calendar year for each program. It shows the credit volume transferred is proportionally lower by half in Oregon. While this might not be that significant, looking at the recent volume trends in Oregon might provide more insights. Figure 1 below shows DEQ data on CFP credit transfers and the prices reported for the transfers. Notice the spike in volumes transferred each April of the last two years, the last month for entities to cover their deficits before being required to participate in a CCM. The record volume of 159,000 credits transferred in April of 2019 is more than double the average number of deficits (75,000) generated per month. These trends indicate that some deficit-generating entities need to catch up on credit purchases months after generating deficits. Corresponding volume spikes in each of the last two Decembers support this idea that some deficit-generating entities are not purchasing ratably and instead catch up on their credits balances at year end.
Figure 1. CFP Credit Transfer Data
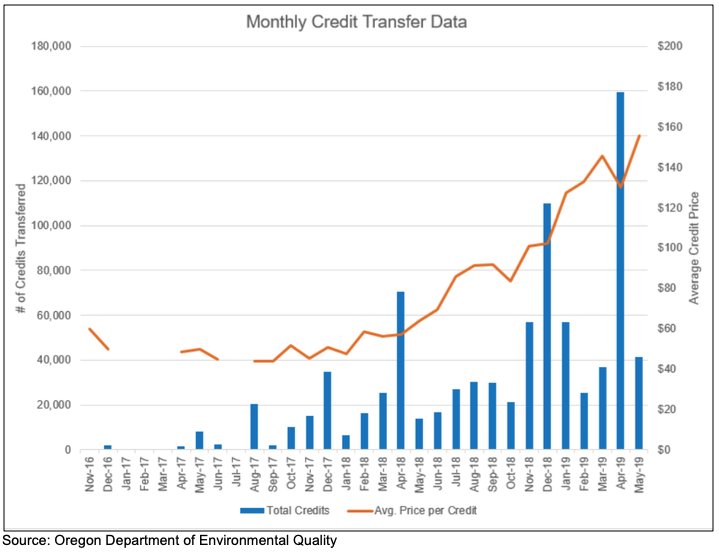
Notice also in Figure 1 that average transaction price declined in April even though there was a record number of credits sold. Buyers did not need to “bid up” prices during that month in order to obtain most of the credits they needed. Sellers supplied the large number of credits in April at a price lower than seen in March. However, the rising price trend observed over the past 18 months continued in May, as one might expect in a balanced-to-slightly-short market with a modest credit bank and competition for lower-carbon fuels from the larger California market.
Lastly, the information DEQ provided on the entities participating in credit transfers is displayed in Table 2 below. The table provides some insight into the nature of the CFP credit market. There are more entities only buying credits (33) than those only selling (21). While it is possible some of those only buying credits might be traders building positions in a strong bull market, it is likely that most are deficit generators. Those who are only selling probably have significant length that needs to be monetized. The last group are traders who have been making tidy profits if they bought early and have carried that length forward.
Table 2. Monthly CFP Credit Transfer Report (May 2019)

Source: https://www.oregon.gov/deq/aq/programs/Pages/Clean-Fuels-Data.aspx
Want more analysis like this? Subscribe to our LCFS newsletter in which we offer weekly, monthly, and quarterly insights into California’s LCFS, Oregon’s CFP, and other LCFS-like programs.
Tags: CFP, Clean Fuels Program, LCFS, Low Carbon Fuel StandardCategories: Policy