The Social Cost of Carbon Part 2: Values Used Around the World & What it Costs to Reduce Carbon in California’s Diesel Pool
Link to article: https://stillwaterassociates.com/the-social-cost-of-carbon-part-2-values-used-around-the-world-what-it-costs-to-reduce-carbon-in-californias-diesel-pool/
October 19, 2021
By Jim Mladenik
Stillwater’s first article on the social cost of carbon (SCC) defined the term and covered how the U.S. estimates the cost of climate change. In that article we also pointed out the fact that the U.S. federal government has used numbers varying from $41 per metric ton (MT) under the Obama administration to near $1 per MT under President Trump and, as of February 2021, $51 per MT under the Biden administration. In this article, we will explore the range of SCC values used around the world and in various U.S. states and then specifically estimate the actual cost to reduce carbon in California’s diesel pool.
In its May 2019 Decision Adopting Cost-Effectiveness Analysis Framework Policies for All Distributed Energy Resources, the California Public Utilities commission (PUC) recommended the use of a discount rate of 3%, but acknowledged that High Impact values should also be considered because of the great challenges involved in estimating SCC. The table below from the PUC analysis (annotated by Stillwater with red boxes to highlight the pertinent data) shows the range of SCC values considered by the PUC.
Note: The “discount rate” – the rate used to discount future economic harm to the present – strongly affects the calculated SCC and is open to considerable debate. The rates used in the U.S. have typically been between 3% and 7%, but a survey of 197 economists found the average long-term discount was 2.25%, and almost all of them were happy with rates between 1% and 3%.
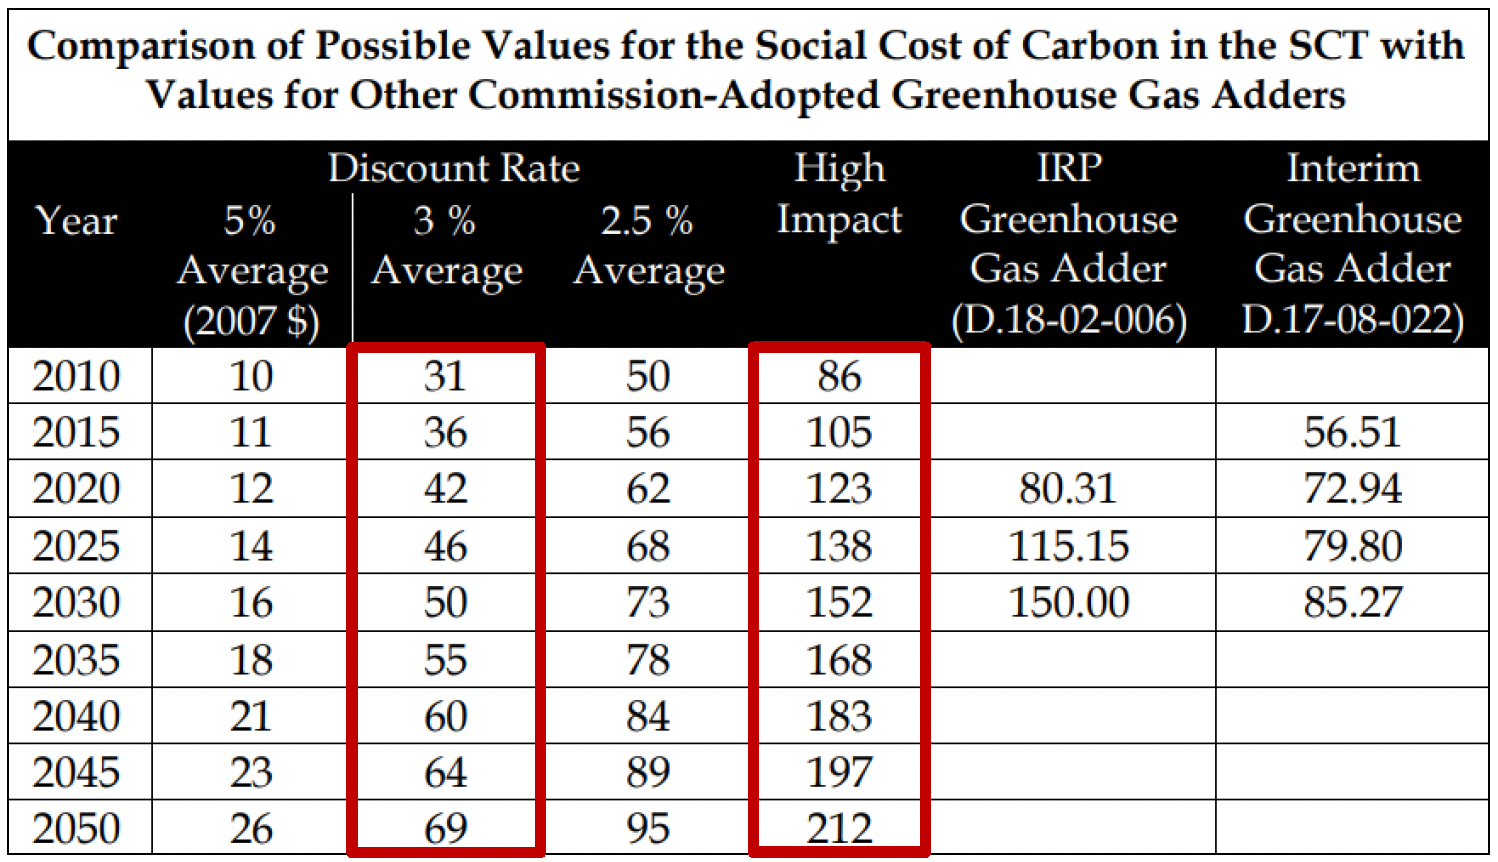
Source: Decision Adopting Cost-Effectiveness Analysis Framework Policies for All Distributed Energy Resources. Note: Costs quoted are 2007 dollars.
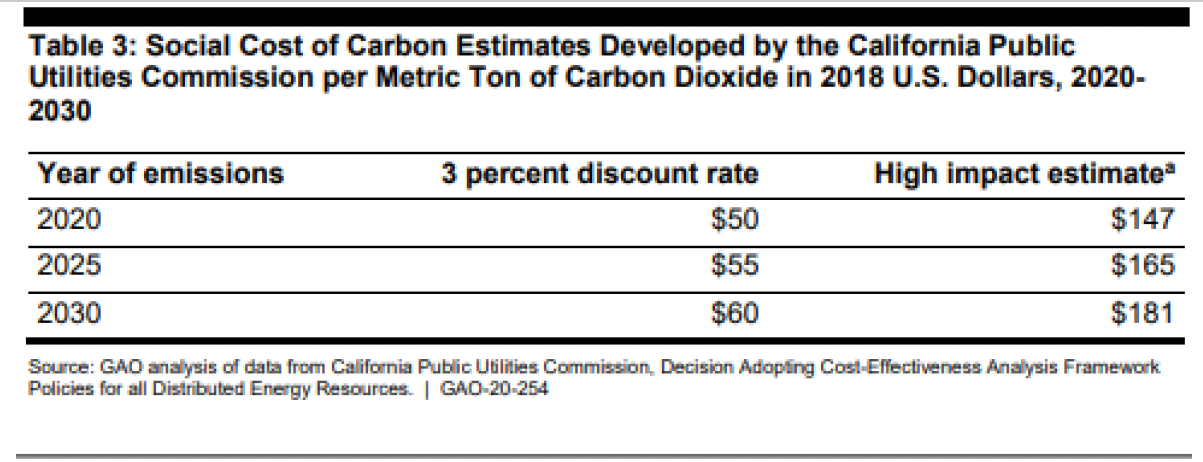
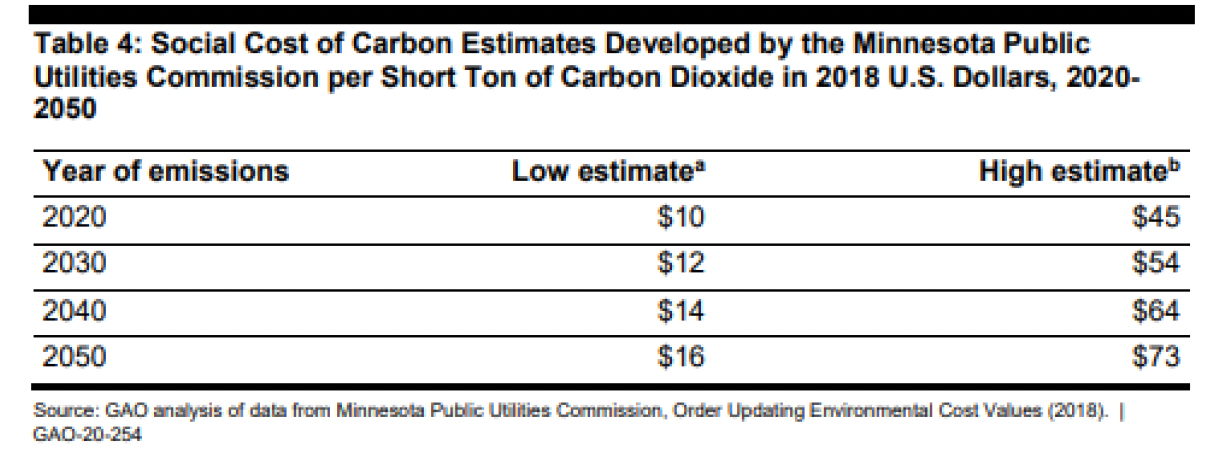
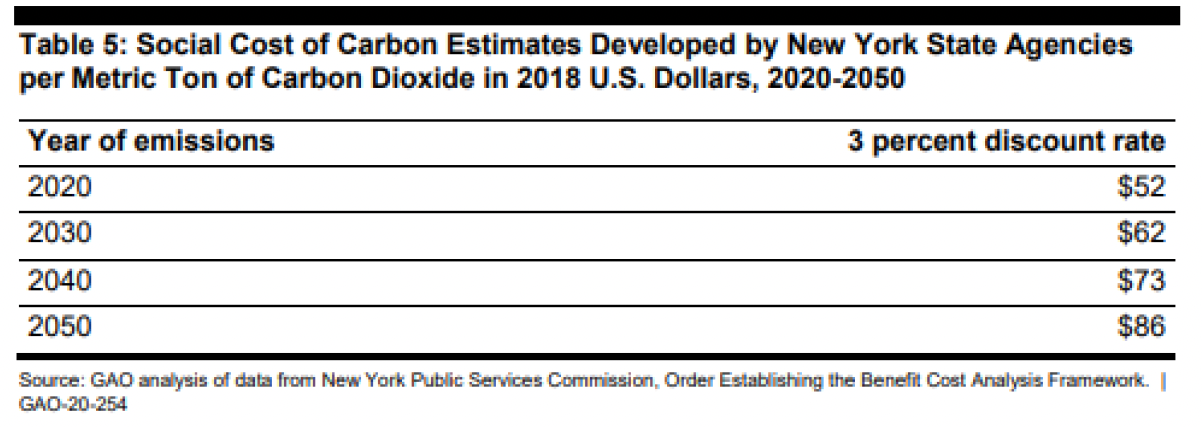
A June 2020 U.S. Government Accountability Office (GAO) report offers a broader view of SCC values used across the U.S. and around the world. As shown in the tables below, estimates used in California and New York were calculated with a 3% discount rate and are similar to the high estimate used in Minnesota as all are in the range of $45 to $52 per MT in 2020 (measured with 2018 dollars). California’s high impact cost estimates are three times the cost calculated at the 3% discount rate.
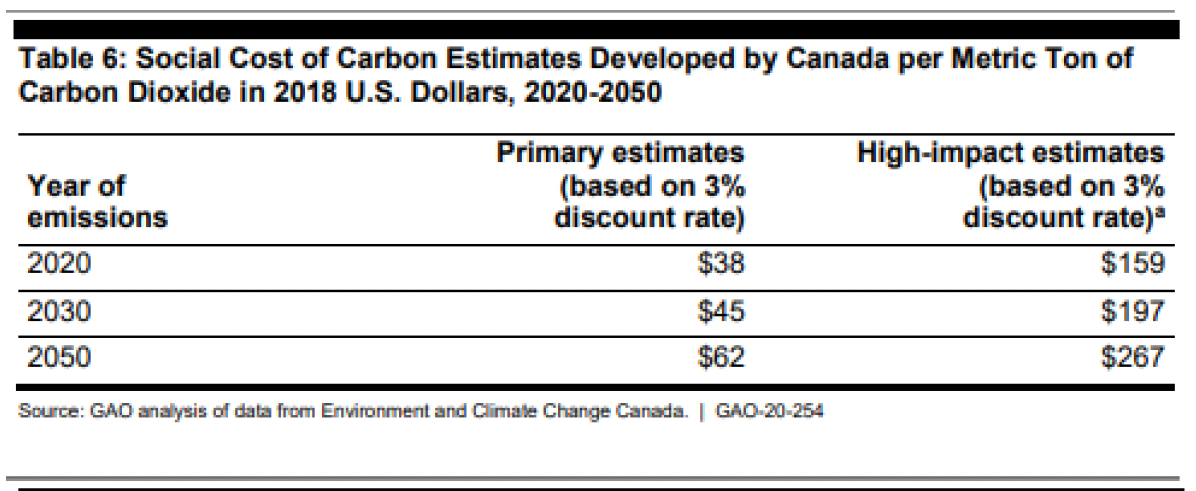
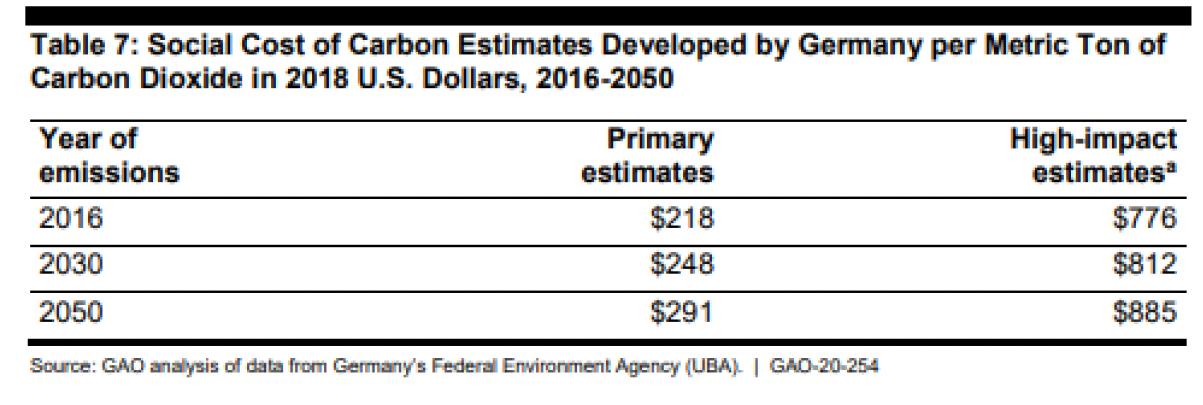
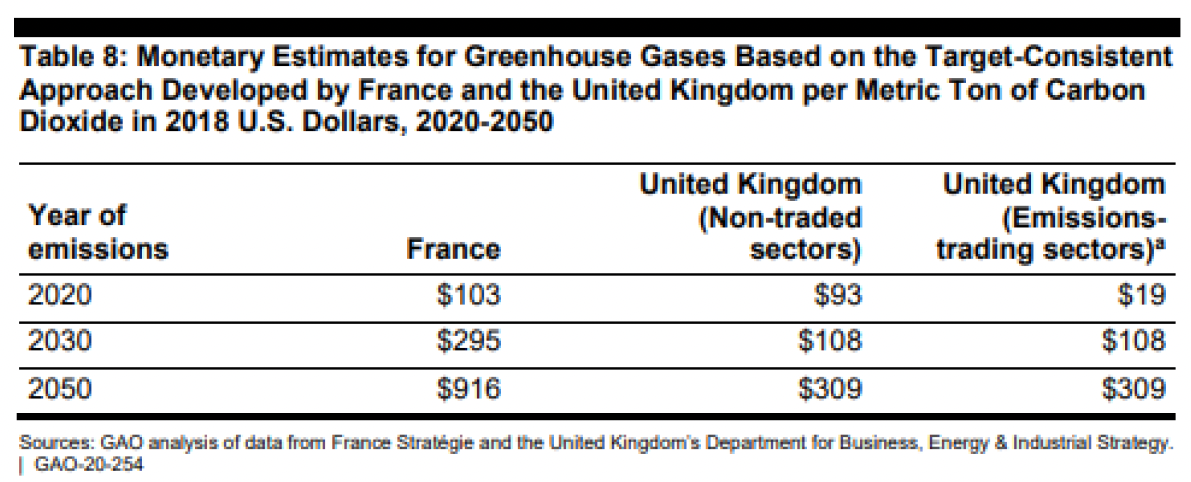
The GAO report also lists SCC estimates used in Canada, Germany, France, and the United Kingdom, as shown in the tables below. Canada’s SCC estimates are similar to those used in California, but Germany’s values are roughly four times higher. The estimates listed for France and the UK are not technically SCC values; rather, they are estimates of the values required to meet specific carbon reduction goals set by the national government. Overall, the range in values used in these three examples are generally much greater than what is being used in the United States, varying from $19 per MT in the UK’s emissions trading sectors in 2020 to $776 per MT for Germany’s high impact estimate for the same year. The 2050 values range from $62 to $916 per MT. This wide range of values testifies to how difficult it is to quantify and estimate the SCC.
Now that we have seen the range of estimates for SCC, let’s switch gears and consider the available data on how much it costs to decarbonize an economy. Historically, the power sector has been considered the easiest to decarbonize. In fact, the cost of solar power has fallen by 82% in the last decade and the cost of power generated by onshore wind projects is reported to have declined by 56% over the same time frame. Consistent with this, California carbon emission reductions to meet the Carbon Cap and Trade (C&T) program launched in 2013 have mostly been met by decarbonizing the power grid. Meanwhile, California’s Low Carbon Fuel Standard (LCFS) program was developed to specifically incentivize the decarbonization of the transportation sector because it was widely accepted that decarbonizing transport would be more difficult and expensive than the power sector. The LCFS adds significant incentives on top of the C&T program to lower carbon emitted from California transport fuels. In addition, there are significant incentives from U.S. federal government programs to replace high carbon petroleum fuels with lower carbon renewable fuels.
So, what is the cost of reducing transport carbon in California today? Using pricing information published by OPIS for diesel, LCFS credits, and Renewable Fuel Standard (RFS) renewable identification numbers (RINs), we calculate the total value of a specific low-carbon renewable diesel that has a carbon intensity (CI) of 40 g/MJ on two specific days in the past sixteen months as shown in the following table:
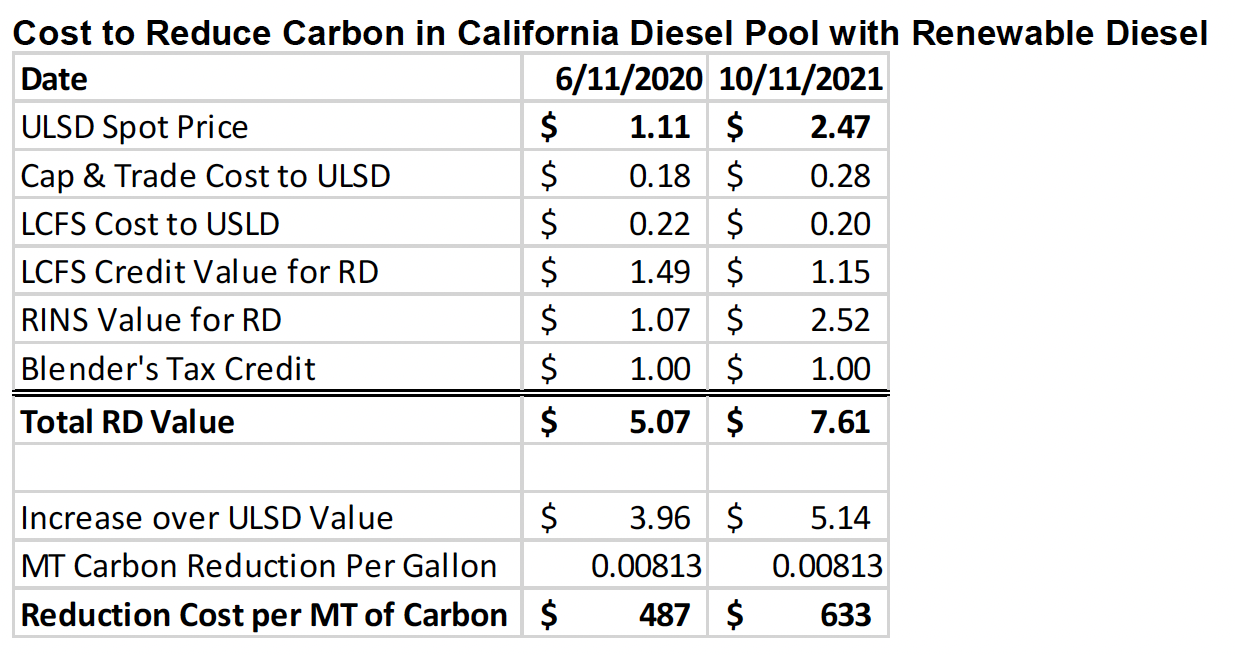
RD was valued at three to five times that of ULSD on the two days considered in the table above. The difference between ULSD value (here depicted as the OPIS spot price in Los Angeles) and the RD value is between $4 to $5 per gallon, which is an estimate of the costs paid by consumers and taxpayers to displace diesel with RD. Each gallon of RD has about 60% less life-cycle carbon emissions than ULSD, so the cost for this reduction on these two specific days is $487 and $633 per MT. This is five to ten times higher than the SCC referenced by the California PUC, which means that if those SCC values are accurate, RD into California costs more than the estimated economic harm it is preventing due to climate change. As noted above, however, quantifying and estimating SCC is clearly fraught and challenging. On the other hand, the federal incentives for RD are in place partly to reduce carbon but also to reduce petroleum imports and encourage demand for agricultural projects. In addition, some of the highest estimates of SCC such as those used in Germany are actually higher than these costs which are paid for by California consumers of gasoline and diesel, U.S. taxpayers, and U.S. consumers of gasoline and diesel.
In future parts of Stillwater’s series on SCC, we will look at the costs to reduce carbon in other parts of the world’s economy by looking in more depth at various parts of the transport sector, as well as other sectors such as power generation, industrial production, and home energy use.

Get expert insights on LCFS, CFP, BC-LCFS, and RFS credit prices.
Stillwater’s Carbon Market Outlooks help fuels producers and investors cut through the noise, navigate carbon market uncertainty, and plan for the future.
Preview a sample report