Bubble Map Update: Restricted Pipeline Capacity Leads to Big WCS discounts
Link to article: https://stillwaterassociates.com/bubble-map-update-restricted-pipeline-capacity-leads-big-wcs-discounts/
 * Reflects anecdotal prices not posted prices
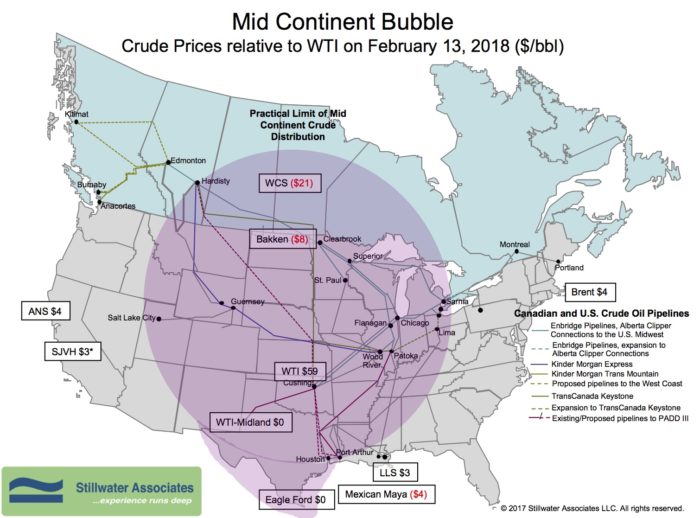
The last time we checked in on crude oil spot prices in bubble map form, the map showed evidence of the lingering effects of recovery from Hurricane Harvey. Now, five months after that storm, the bubble map tells a different story. On February 13th, spot WTI was quoted at $59 per barrel, with Brent $4 higher. The Western Canadian Select discount widened significantly to $21 under WTI. On the Gulf Coast, crude oil from shale formations in Texas like Eagle Ford were priced at parity with WTI, and Louisiana Light Sweet was at $3 over WTI. On the West Coast, the Alaska North Slope differential was $4 over WTI and the San Joaquin Valley Heavy discount was at $5 under WTI while the Mexican Maya discount was $4 under WTI.
The WCS discount to WTI is the largest shown on the Bubble Map for some time. This discount reflects that Canadian production is outpacing efficient pipeline capacity to the Gulf Coast. In November in response to a rupture and leak in South Dakota, PHVSA restricted flows from the Keystone Pipeline by 20%. This sharp decline in pipeline flows from Canada means the last barrel out of Alberta has to move by rail to refining centers.
We’re seeing some discrepancies in the price of SJVH. The quotes for the posting do not seem to reflect market price. The posted price for SJVH on February 13th showed a $5 discount to WTI, however small refiners are reporting to Stillwater that they are paying near Brent price for SJVH. Refiners are actively pursuing California barrels and the discounts to Posting have evaporated.
Categories: Wisdom from the Downstream Wizard