As the RINs Spin
Link to article: https://stillwaterassociates.com/as-the-rins-spin/
March 1, 2021
By Adam Schubert
With the completion of the current season of refiner quarterly earnings reports, federal Renewable Fuel Standard credits – known as renewable identification numbers, or RINs – prices are once more in the headlines. As RIN prices have increased since the beginning of 2020, it is worth taking another look at this key element of U.S. fuels markets.
In short, RIN prices have a short-term variability driven by market news and rumors superimposed over a fundamental basis set by commodity prices and regulatory incentives. Simplistically speaking, RIN values are expected to cover the difference in commodity cost between biofuels blended to meet RFS requirements and the petroleum fuels which they replace. We can consider the fundamental drivers for D6 (corn ethanol) and D4 (biodiesel) RINs in turn –
- D6 RINs – As corn ethanol prices are normally lower than those of gasoline blendstocks for oxygenate blending (BOBs), the D6 RIN has a theoretical value of zero (as there is no cost of goods penalty for blending ethanol.) In practice, however, the floor price has been around two to three cents, and this can be seen as the transaction cost needed to have a party with surplus RINs sell to a party who is short RINs. Since 2013, however, RIN prices have been consistently above this level as the annual renewable volume obligations (RVOs) have been set at levels higher than what can be achieved with E10 blending alone, and E15 and E85 sales have not been sufficient to cover the RVO. As a result, D4 RINs have been used as the marginal source of compliance with the Total Renewable Fuels obligation, and D6 prices have, at times, approached the value of D4 RINs.
- D4 RINs – The fundamental value of these RINs is determined by the price difference between biodiesel and the Ultralow Sulfur Diesel (ULSD) with which it is blended. This value, in most years, is reduced by the $1.00/gal biomass-based diesel blenders tax credit (BTC) which is applicable to each gallon of biodiesel (BD) blended (this corresponds to $0.67 per D4 RIN as each gallon of biodiesel earns 1.5 D4 RINs). These RINs have a price floor equal to the price of D6 RINs as surplus D4s can be used to satisfy the implied D6 obligation. There is no fundamental ceiling on D4 RIN prices.
With that brief refresh on RIN price fundamentals, we can now dive into the recent price activity. We will start by looking at the market price of BD. The primary driver of BD price is the price of soybean oil (SBO) as that is the marginal feed for most BD producers. Recent history of BD prices and the cost of the quantity of SBO required for each gallon of BD is illustrated in Figure 1 (derived from data published weekly by the Center for Agricultural and Rural Development, CARD, at Iowa State University.) This figure shows that BD and SBO prices jumped at the start of 2020, possibly due to expected increases in BD sales due to the newly reinstated BTC. Prices then dropped steeply with the imposition of COVID-19 lockdowns in the early spring and have steadily increased since then. Since October 2020, SBO prices have risen faster than BD prices, squeezing the profits of BD producers.
Figure 1. Price of Biodiesel and Cost of Contained Soybean Oil ($/gal)
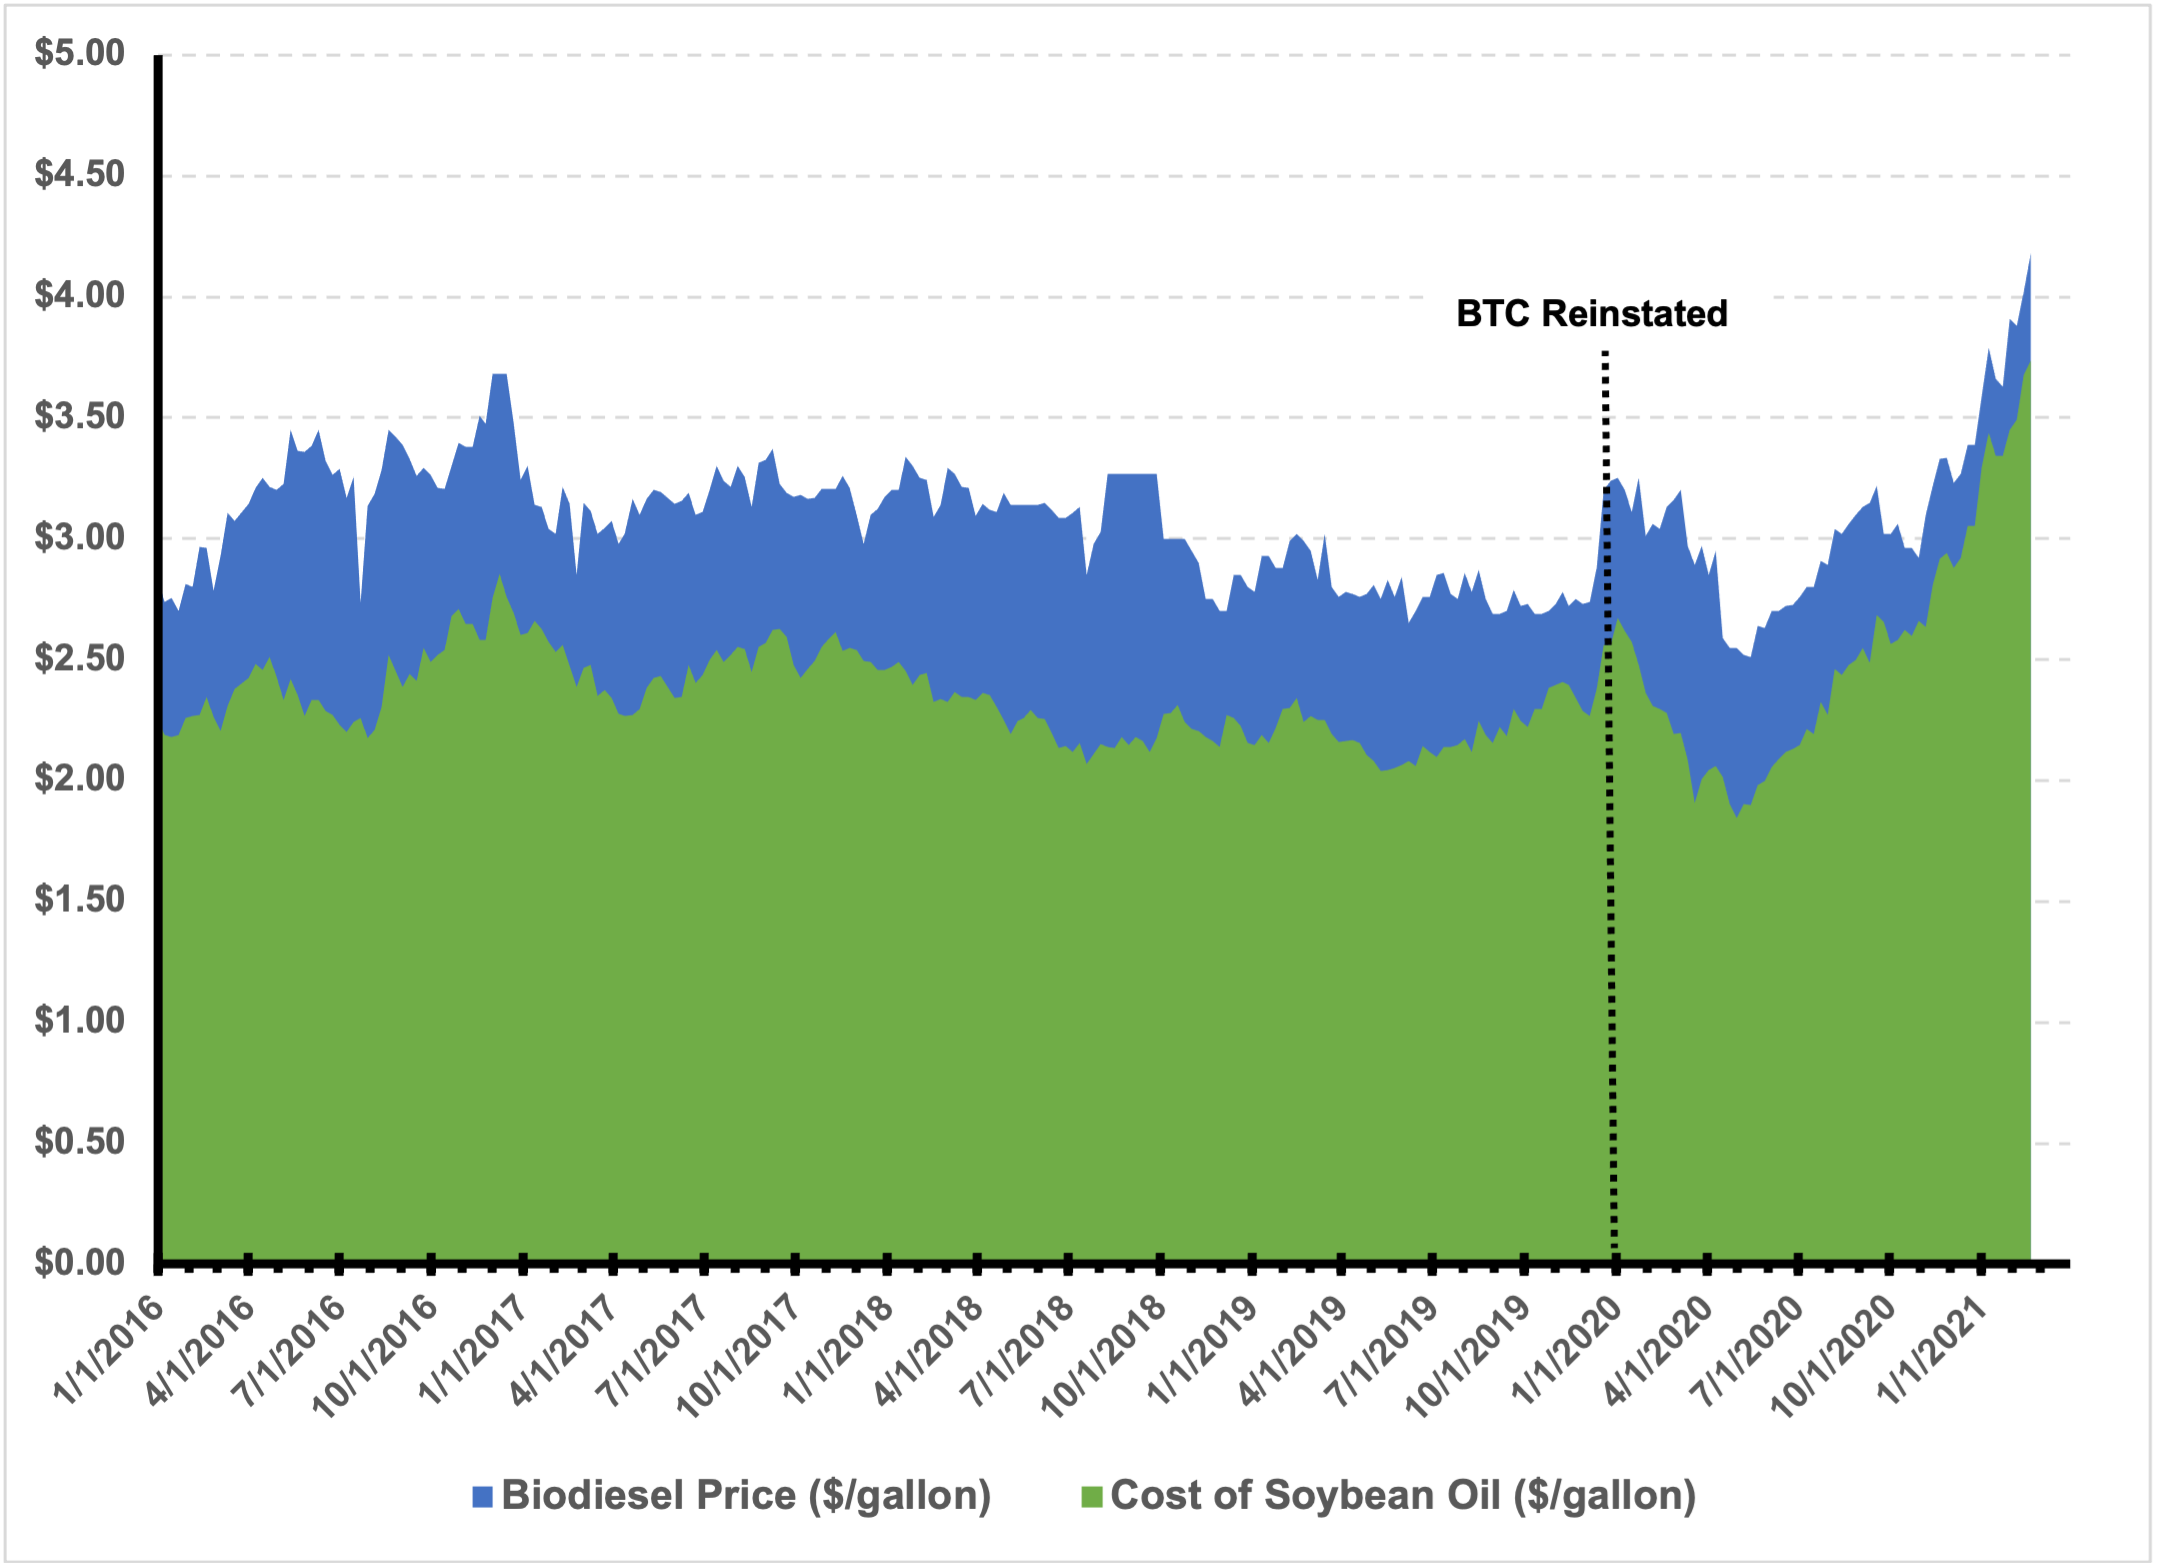
Sources: CARD, Stillwater Analysis
The relationship between the BD price and the price of ULSD is presented in Figure 2 below. The spread between BD and ULSD was relatively low from January 2018 through the end of 2019 (during the most recent lapse in the BTC) and rebounded with the retroactive reinstatement of the BTC. While both BD and ULSD prices have rebounded since the COVID-19 shutdowns in March 2020, BD prices have risen more rapidly, and the spread has grown.
Figure 2. Biodiesel and ULSD Prices ($/gal)

Source: CARD, EIA, Stillwater analysis
Against this backdrop, Figure 3 presents RIN prices compared to (BD – ULSD)/1.5.[1] It may be observed that the price of D4 RINs largely tracks (BD – ULSD)/1.5 with an adjustment for times when the BTC is in place[2] (and some periods when reinstatement was being debated in Congress). Accordingly, the behavior of D4 RINs aligns well with fundamentals. The behavior of D6 RINs can be explained relative to the behavior of the D4s. Prior to the start of the Trump Administration in January 2017, D6 prices were largely tracking D4s as D4s were being utilized for marginal D6 compliance. D6 prices then dropped significantly through the first nine months of 2017 with market expectations on how the Trump Administration was going to manage RFS requirements. By late 2017, D6s resumed tracking D4s but at a somewhat larger discount due to the granting of small refiner exemptions (SREs). Following the 2020 elections, D6 prices rose to levels closer to that of D4s on expectation that fewer SREs would be granted under the incoming Biden administration. The current relationship between D4s and D6s appears to be similar to what was seen in 2016.
Figure 3. RIN Prices and the BD-ULSD Spread
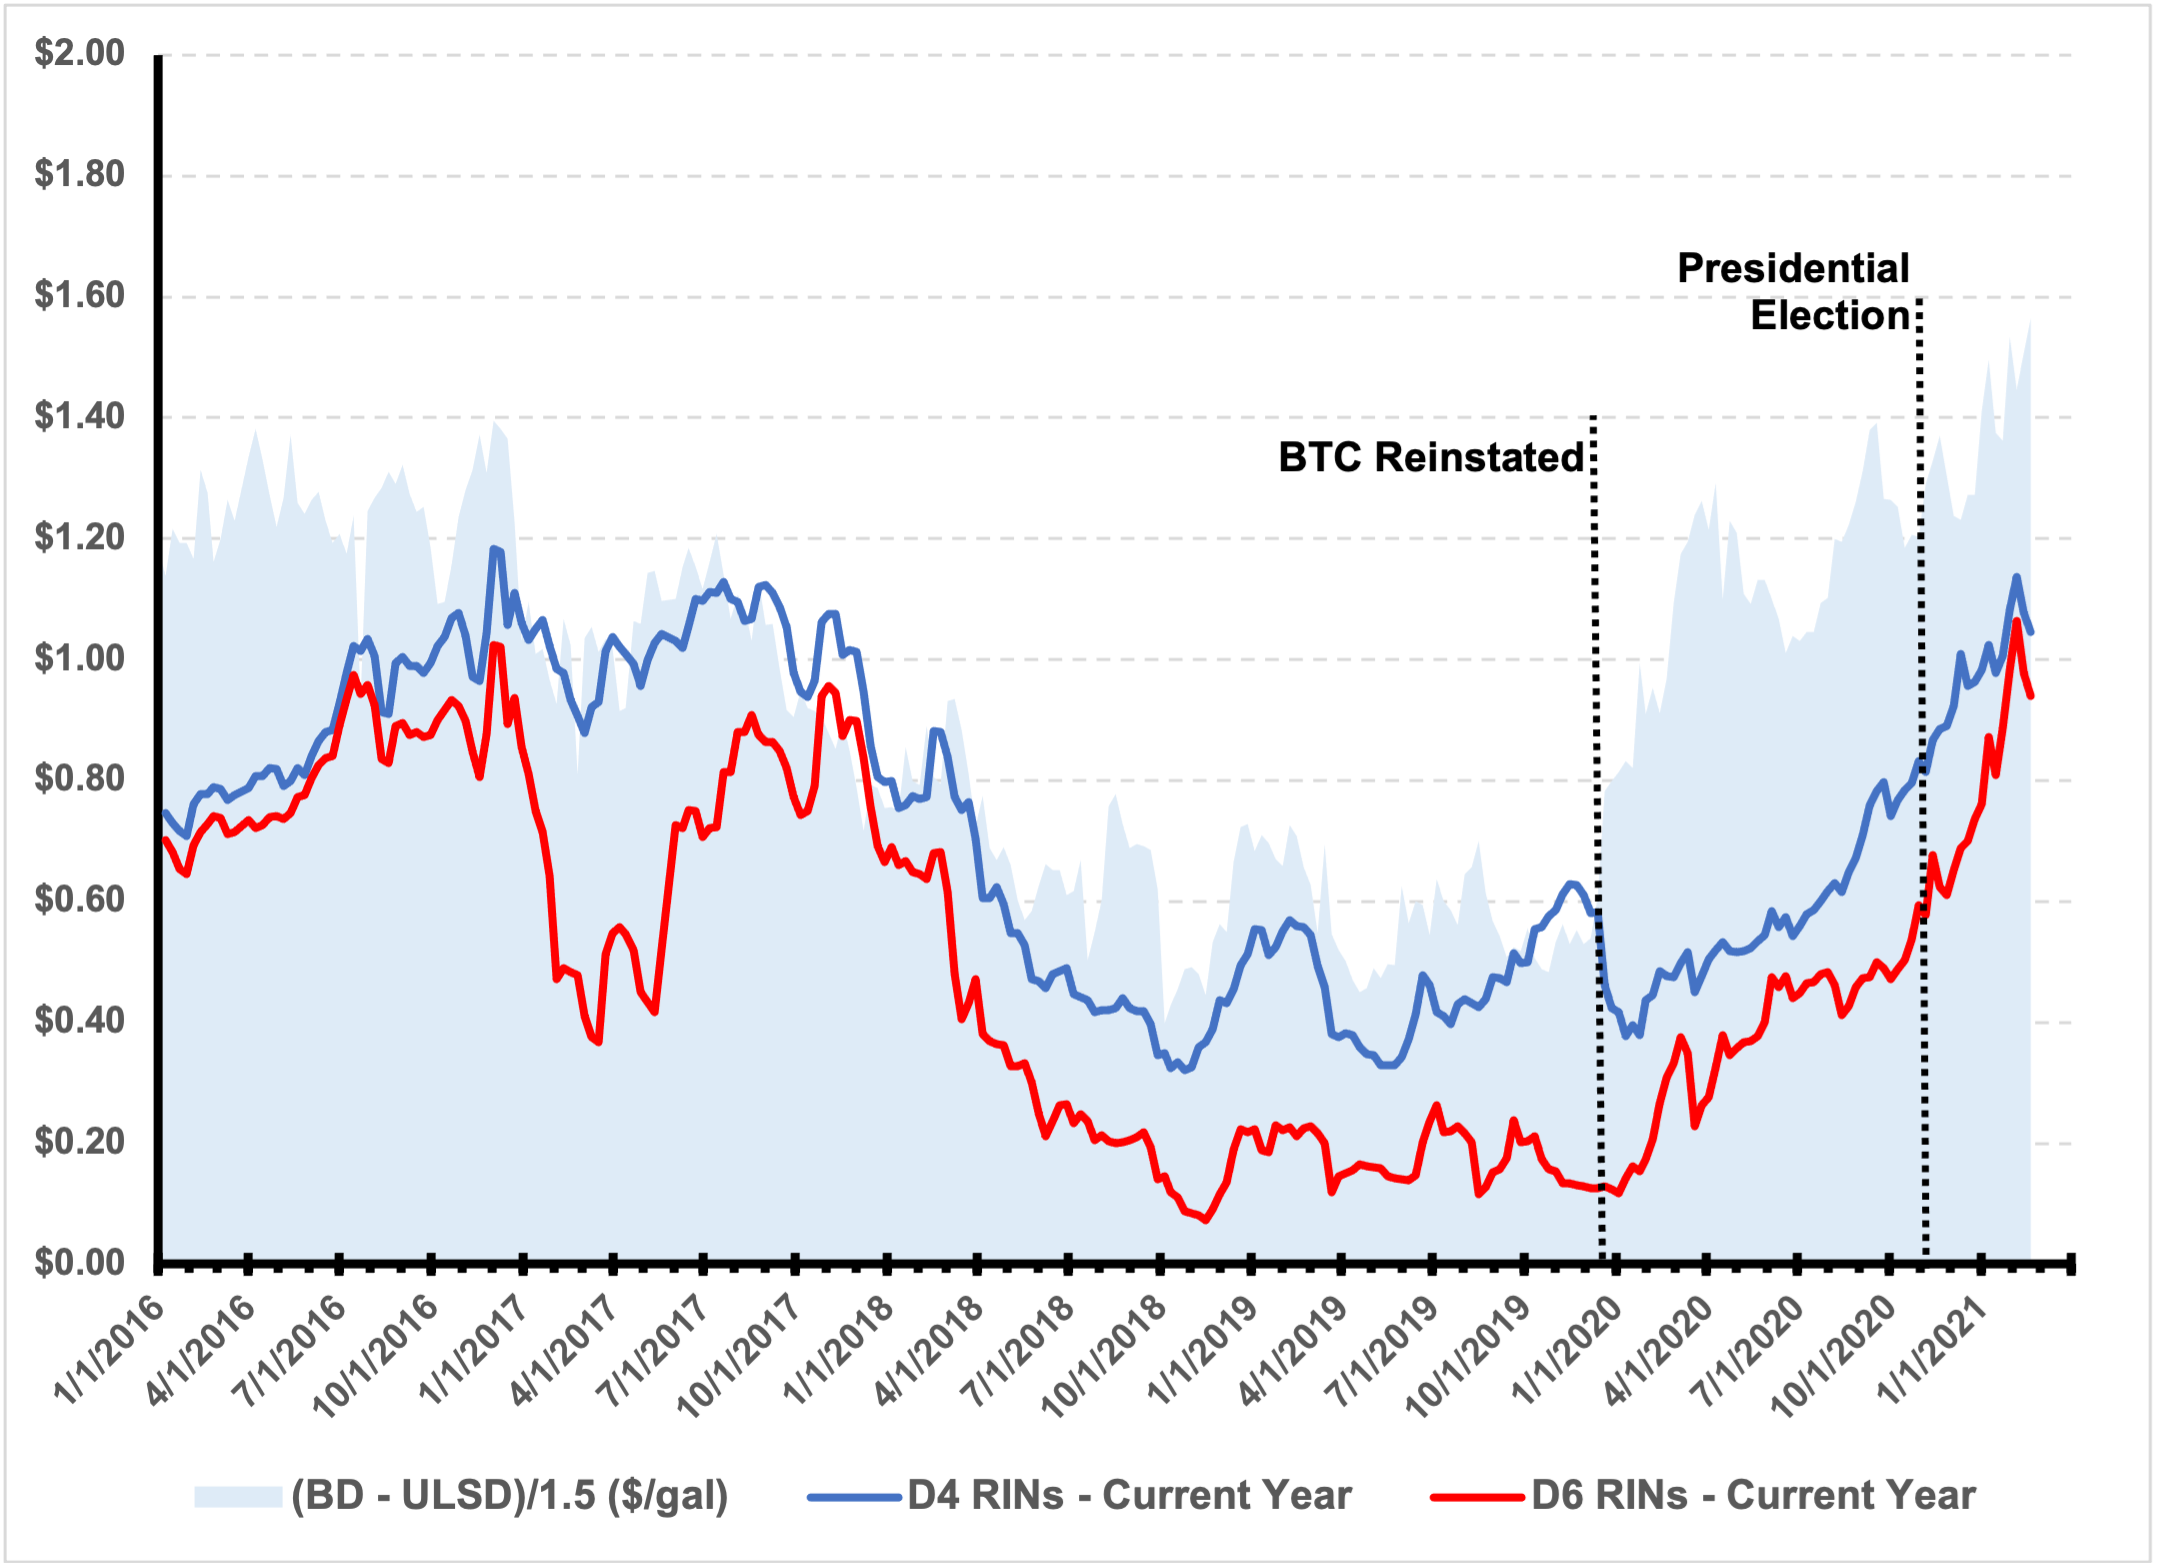
Source: OPIS, Stillwater analysis
Considering the above analysis, we can now consider factors which might result in lower RIN prices —
- Policy Changes – If the Biden Administration were to take actions seen as weakening the RFS, such as allowing for SREs or releasing lower than expected RVOs for 2021 and 2022, D6 prices would be expected to drop relative to D4s. D4 prices would be expected to continue to track fundamentals unless there was a material weakening of the Biomass-Based Diesel RVOs.
- Fundamental Changes – Prices for soybeans and, hence, SBO are currently high due to strong export demand for soybeans. These prices are built around current levels of soybean inventories and expectations for this year’s crop. News of higher-than-expected soybean plantings, which would emerge during April through June, or higher than expected soybean yields, which would emerge during June through August, would place downward pressure on soybean and SBO prices, translating into lower D4 RIN prices. A decrease in D4 RIN prices would then force D6 RIN prices downward as well.
Of course, news in the opposite direction for both of these areas would be expected to result in higher RIN prices.
Need additional help understanding how the RINs will spin, the future possibilities for the RFS, or other renewable fuel policies? Contact us to see how we can help answer your specific questions.
[1] The division by 1.5 adjusts for the fact that each gallon of BD earns 1.5 RINs.
[2] At $1.00 per gallon of BD, the BTC corresponds to $0.67 per D4 RIN.
Tags: D4 RINs, D6 RINs, Renewable Fuel Standard, RFS, RINs