Where Will All the Diesel Go?
Link to article: https://stillwaterassociates.com/where-will-all-the-diesel-go/
December 13, 2023
By Jim Mladenik
For those interested in the West Coast supply of transportation fuels, the ongoing and continuing growth of renewable diesel (RD) production should be of great interest. As shown in Figure 1 below, RD production capacity in the United States is expected to increase by a factor of ten between 2019 and 2025 and more than double between 2022 and 2025. Most of the existing production from these facilities has been sold into West Coast markets – California in particular – displacing petroleum diesel previously produced and supplied by West Coast refineries. This trend begs an important question for these refiners: Where will they sell the petroleum diesel they produce?
Figure 1: Annual existing and expected U.S. RD production capacity (2010-2025)
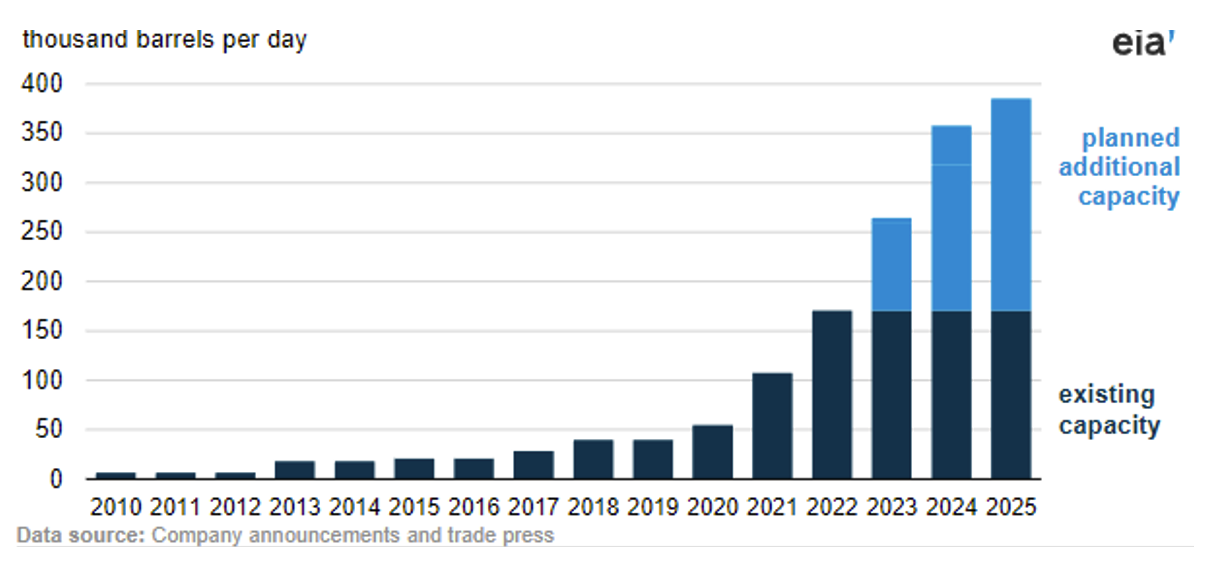
Source: https://www.eia.gov/todayinenergy/detail.php?id=55399
First, a quick look at RD’s impact on BD
Petroleum diesel is not the only fuel displaced by RD. A look at the relationship between the two primary biomass-based diesels – RD and biodiesel (BD) – shows that the growth in U.S. RD production capacity has led to increased competition with BD plants for feedstocks. Because of this, BD production in the U.S. peaked in 2016, and RD production subsequently increased to exceed it in 2022 as shown below in Figure 2.
Figure 2: U.S. RD and BD Production
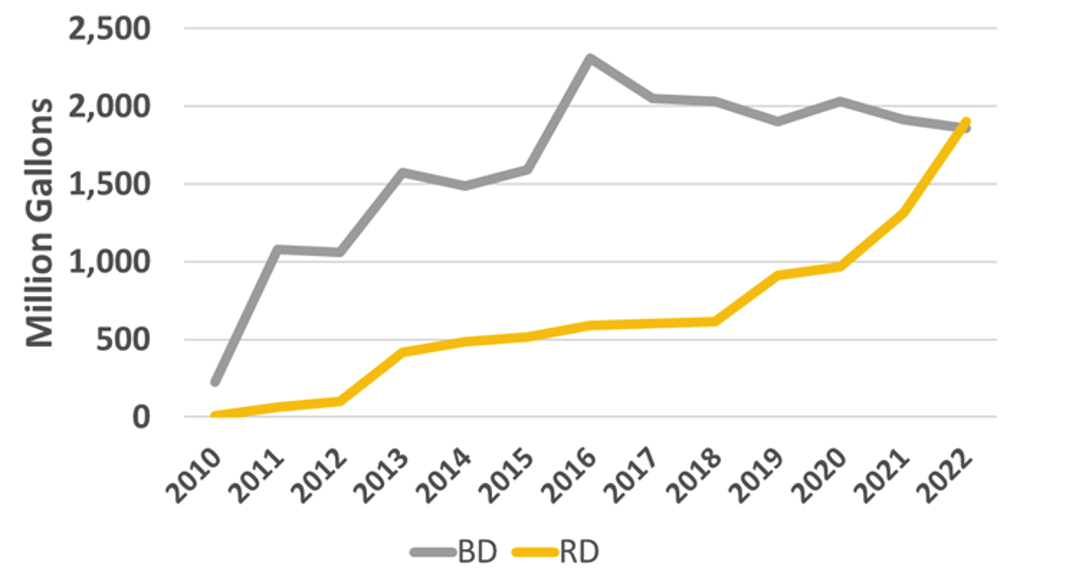
Source: USDA Quickstats
BD production grew over time to meet the demand established by the U.S. Renewable Fuel Standard (RFS). It can be blended up to 5% into petroleum diesel anywhere in the U.S. and sometimes at much higher levels for newer vehicles. Despite the significant capital costs to build production facilities, RD has been able to displace BD for two key reasons:
- RD can safely be blended up to 100% with petroleum diesel, and
- RD can therefore be blended at much higher levels into the West Coast states with regulations that substantially increase its value (e.g., California’s Low Carbon Fuel Standard and Cap and Trade programs).
Let’s look at how this has played out in California since it adopted the LCFS
As shown in Figure 3 below, BD and RD have grown from negligible levels in 2011 to more than 60% of the liquid diesel pool1 in the second quarter of 2023. As can be seen, RD consumption has accelerated in the last ten quarters, accounting for all the increases in renewable consumption. If the additional RD capacity shown in Figure 1 comes online over the next two years, there is likely to be sufficient supply to saturate (i.e., supply over 95% of) the California market. There is also significant excess supply to begin to saturate the Washington and Oregon markets that also have low carbon fuel (LCF) and Cap and Trade (C&T) programs.
Figure 3: BD and RD Trends in California (2011-2Q2023)
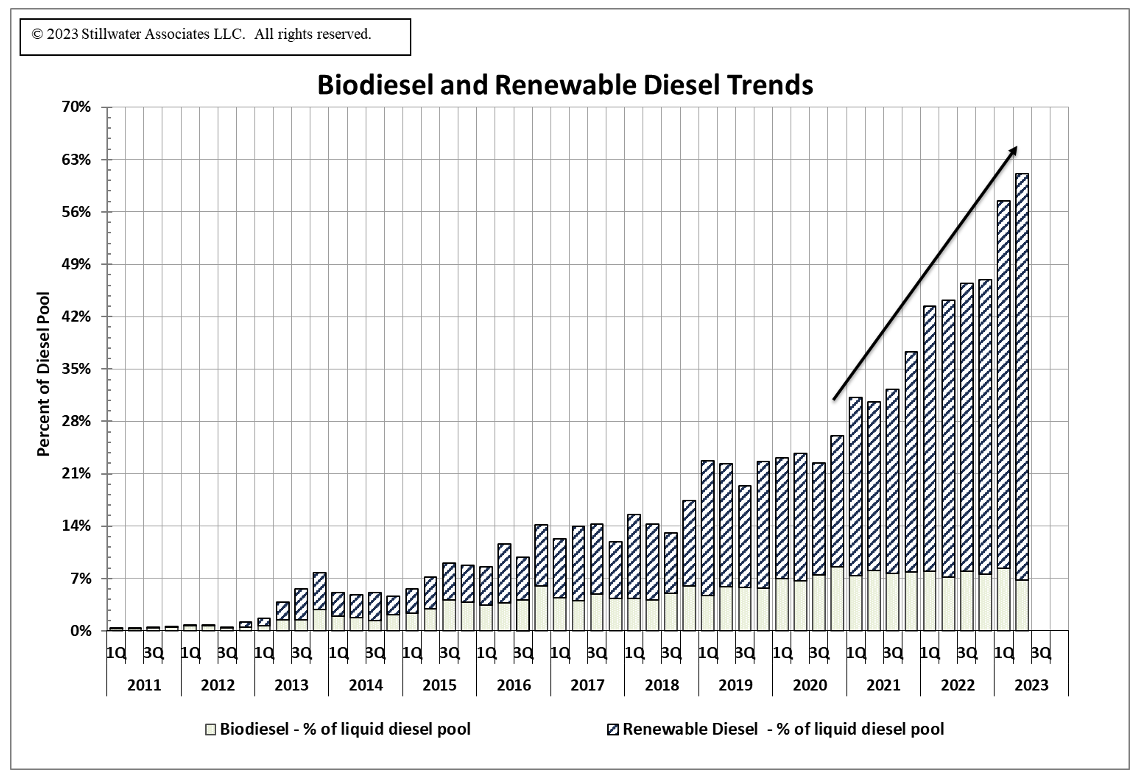
Sources: CARB and Stillwater Analysis
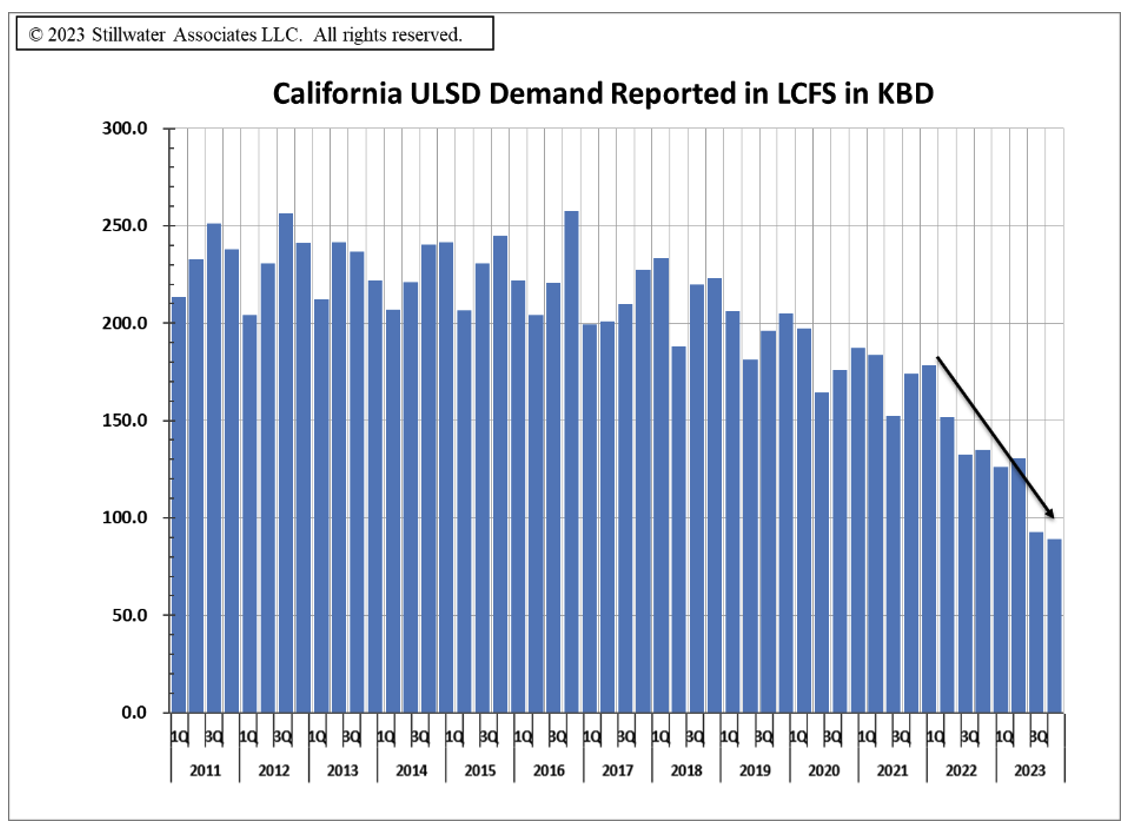
How has this growth in RD impacted ULSD usage in California? Figure 4 shows the decrease in petroleum diesel demand corresponding to the increase in RD over the same time frame. This leads us back to the original question: “Where will all this displaced diesel go?”
Figure 4: California ULSD Demand (thousand barrels per day)
The West Coast has exported diesel for a long time, but this is a new phase
The dominant demand center in the region, California, has a very high ratio of gasoline to diesel demand; accordingly, West Coast refineries have been built to maximize gasoline production. Even so, West Coast refiners have historically produced excess diesel that needs to be exported. Further complicating matters, the drastic reduction in fuels demand during the early stages of the COVID-19 pandemic resulted in two Northern California refineries being converted into RD production facilities, which caused the West Coast to transition from long to slightly short gasoline. While also slightly short jet fuel, the region continues to be long diesel and is growing longer due to RD displacement.
In 2022, about 60 thousand barrels per day (KBD) of diesel were exported, mostly to the West Coast of Latin America which is also supplied by Gulf Coast and Asian refineries. In 2023 there has been 140 KBD of liquid diesel demand in California and about 130 KBD of liquid diesel demand in the Pacific Northwest. The new RD capacity coming online over the next two-to-three years could displace half of this diesel fuel, requiring West Coast exports of nearly 200 KBD to keep refineries operating near full capacity.
But there are even more factors at play
Most West Coast diesel exports have historically been placed on the West Coast of Latin America, and supply competition has historically come from the U.S. Gulf Coast, with additional supply coming from Asia. To project future supply into this region – and, therefore, incremental diesel export opportunity for West Coast refiners – requires understanding many complex factors, including:
- The new 340 KBD Dos Bocas Refinery current starting up in Mexico which is designed to produce 120 KBD of diesel.
- The addition of 1,300 KBD of refining capacity to China since 2019 with another 1,200 KBD being planned.
- The recent 240 KBD expansion of the ExxonMobil Gulf Coast Refinery in Beaumont, Texas.
- Changes in global trade flows and shipping rates due to the war in Ukraine.
- Reductions in capacity and higher costs to move shipments through the Panama Canal due to the drought-induced water-level crisis.
The result of these and other complicating factors is that the ability of West Coast refiners to economically export diesel will vary considerably over time.
What can refiners do to balance diesel production in the face of these risks?
Some alternatives include:
- Maximize gasoline and/or jet production at the expense of diesel
- Replace 60 KBD of imported vacuum gasoil with diesel feed into fluid catalytic cracking units (FCCUs)
- Reduce refinery crude rates to crack more diesel in the FCCUs
- Refinery conversion and/or closure
Stillwater is closely tracking and constantly analyzing this ULSD displacement trend and many others on the West Coast. We stand ready to assist you with business and transition strategy. Contact us to learn more!
1 The term “liquid diesel pool” refers to the total of all forms of diesel in the market – fossil diesel (ULSD), biodiesel (BD), and renewable diesel (RD).

Get expert insights on LCFS, CFP, BC-LCFS, and RFS credit prices.
Stillwater’s Carbon Market Outlooks help fuels producers and investors cut through the noise, navigate carbon market uncertainty, and plan for the future.
Preview a sample report