What is displacing fossil diesel in California?
Link to article: https://stillwaterassociates.com/what-is-displacing-fossil-diesel-in-california/
March 4, 2024
By Gary Yowell
Last month we published Part 1 of this two-part series on fossil fuel displacement in California. In Part 1 we discussed the factors contributing to the displacement of fossil gasoline in the state. We conclude that the primary factors reducing petroleum gasoline demand in California are reduced driving (largely driven by higher gasoline prices, slowing population growth, and the impacts of COVID), increased fuel efficiency, and expanded use of renewable fuel. In this Part 2 installment, we will cover what is displacing fossil diesel (and the associated greenhouse gas emissions) in California.
For over two decades, Stillwater has monitored the rate of fossil fuel consumption and associated greenhouse gas (GHG) emissions in California as well as the factors influencing these trends. As shown in Figure 1 below, California has reduced petroleum diesel consumption in the state by 30%, 3.5 billion gallons compared to the projected trend (extrapolated from the historic trendline). Our ongoing analysis reveals that the main drivers of declining fossil diesel use and associated GHG emissions are 1) the abrupt reduction in fuel sales due to the 2008/2009 recession (i.e., demand destruction) and 2) the proliferation of renewable fuels (i.e., fossil fuel displacement). We discuss each of these factors and their temporal evolution in this article.
Figure 1. Diesel Sales Trend (On- and Off-Road Diesel) (1950-2023)
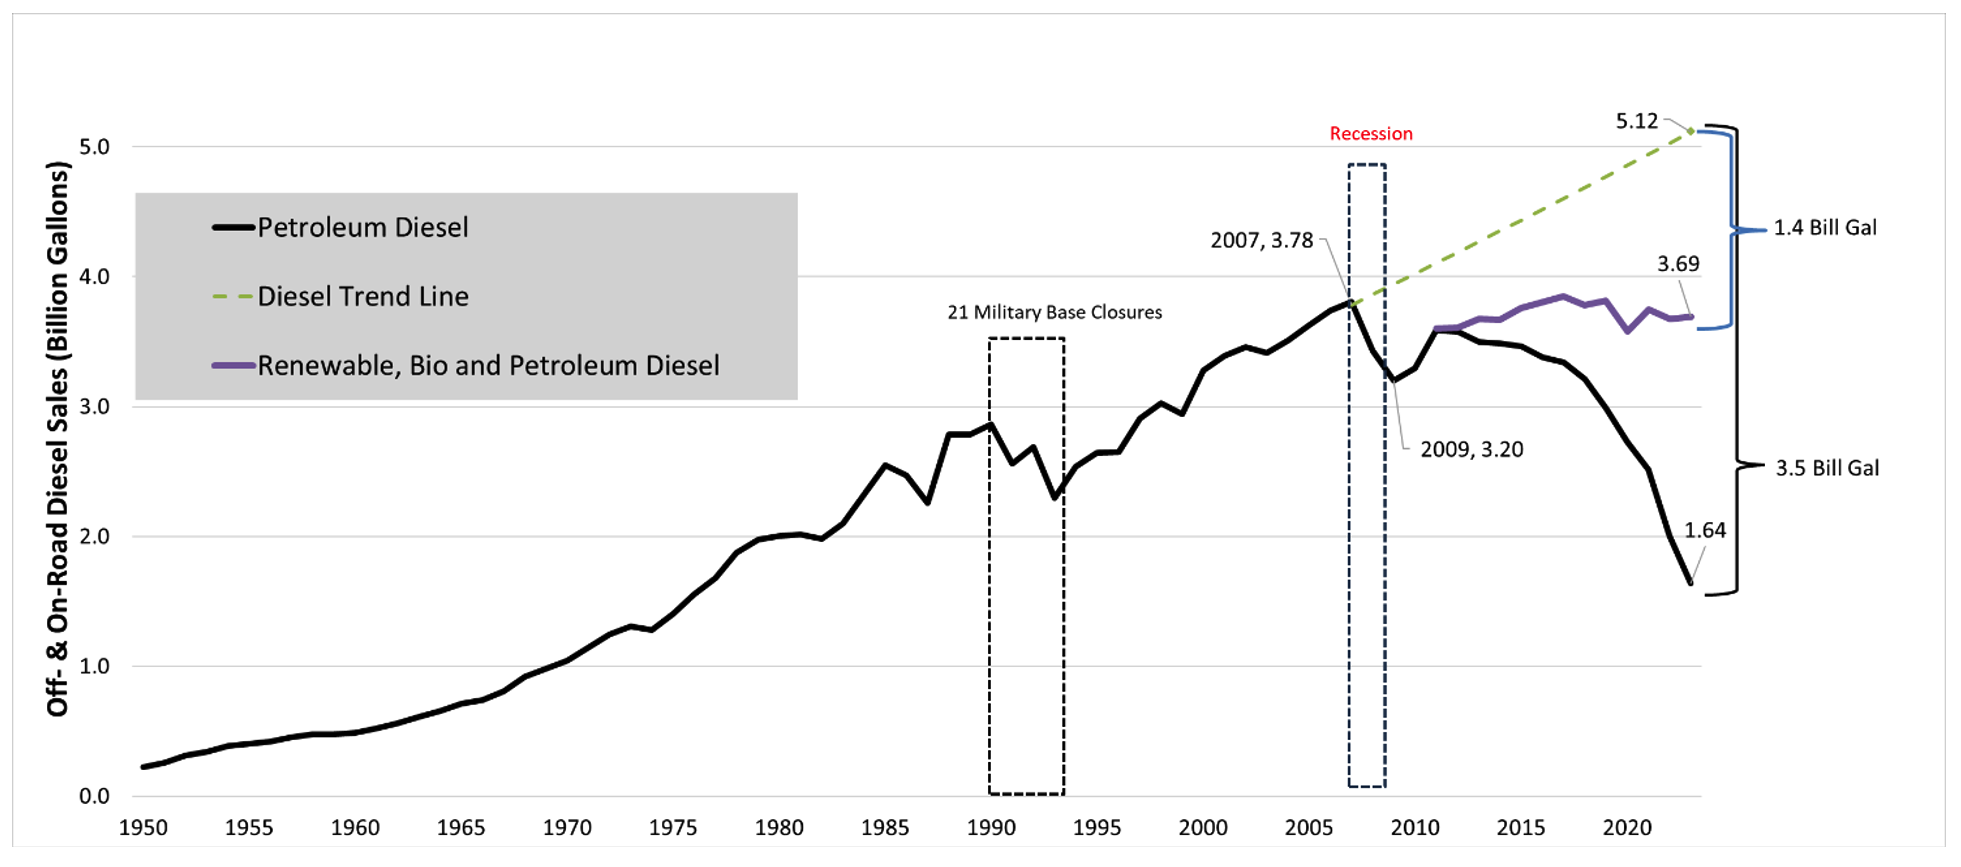 Source: Stillwater analysis of Board of Equalization (BoE), California Tax and Fee Administration (CTFA) Taxable Diesel Sales and LCFS Reporting Tool data
Demand Destruction
The recession and post-recession periods reduced diesel demand by 30%. As shown in Figure 2 below, diesel fuel sales responded quickly to economic changes in 2008 and 2009. High diesel prices no doubt played a role in reducing diesel demand, but most diesel is used in business-related activities (i.e., transport and delivery of goods through the supply chain) rather than personal, light- or medium-duty discretionary driving which makes up the bulk of gasoline fuel use. As such, diesel demand responds less dramatically than gasoline demand to fuel price increases, but diesel demand can respond more dramatically to economic downturns.
Proliferation of Renewable Fuels
As shown in Figure 2, below, biodiesel (BD) and renewable diesel (RD) use has grown significantly since 2011 when the California Air Resources Board (CARB) implemented the Low Carbon Fuel Standard (LCFS). As of the latest LCFS data available (representing 3Q2023), these two fuels represent 57% of the liquid diesel fuel pool (all BD, RD, and petroleum diesel combined). You read that right: Well over half of the diesel used in California today is renewable. This is largely possible because RD and BD are “drop-in fuels” – they are compatible with existing diesel infrastructure, retail stations, and vehicles. (Note: Blending limitations exist for BD, but up to 100% RD blends are fully compatible with existing diesel vehicles and infrastructure.)
Other Contributing Factors
COVID lockdowns resulted in a small and temporary reduction in driving and therefore diesel use before 2023. Additionally, in 2023, natural gas vehicles contributed 8%, and propane contributed 1% of the petroleum reduction. CARB’s zero emission vehicle (ZEV) incentives for medium- and heavy-duty EVs, and Advanced Clean Fleets program requiring electric vehicles (EVs), and plug-in hybrid electric vehicles are estimated to account for 4% of all petroleum diesel reductions in 2023. A keen reader may note that fuel efficiency is not listed here as a significant contributing factor for reduced petroleum diesel demand as it is for gasoline demand. While vehicle manufacturers are constantly striving for improved fuel economy in diesel vehicles, these gains are slow to migrate into the vehicle fleet to make an impact and are also counteracted by the ever-increasing drive for additional power from diesel vehicles.
Figure 2. Petroleum Reduction Factors Impacting Diesel Fuel Sales Trend
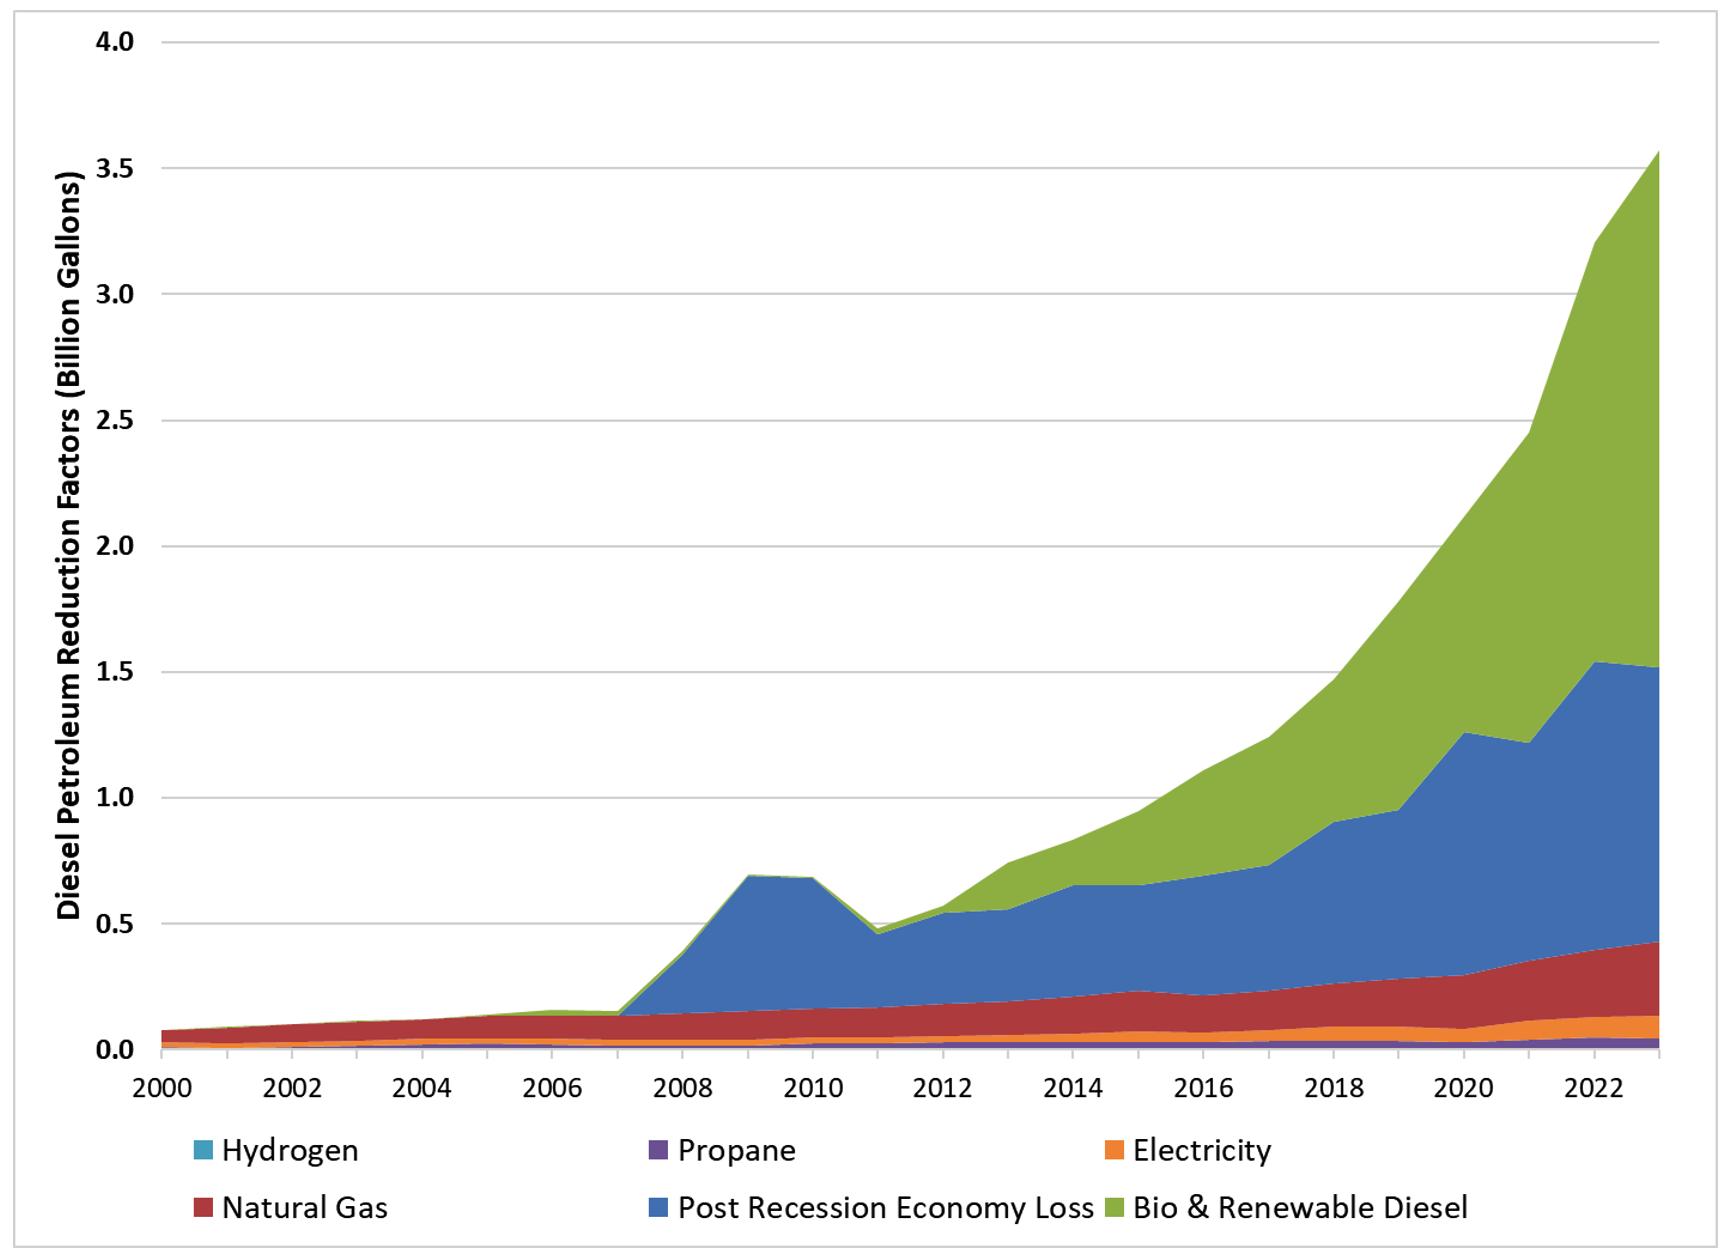 Sources: Stillwater analysis of CEC-DMV Registered Populations, LCFS Reporting Tool data, and the EPA Fuel Economy Guide
Greenhouse Gas Emission Reductions (GHG)
We estimate GHG emission reductions using CARB’s LCFS program data. Figure 3, below, shows that biofuels dominate GHG reductions in line with their impact on petroleum fuel reductions. In 2023, California’s Post-Recession Demand Destruction is 50% of all reductions and biofuels represent 36%. Off-Road electricity used in forklifts, Light- and Heavy-Rail, and trollies is 12% of all transportation uses. On-Road electricity used by transit buses, and medium and heavy-duty trucks represent 0.3% of the 2023 GHG reductions. Projected GHG reductions are shown to 2030 assuming continued growth in all diesel reduction factors.
Figure 3. Historic and Projected Transportation Greenhouse Gas Emission Reductions
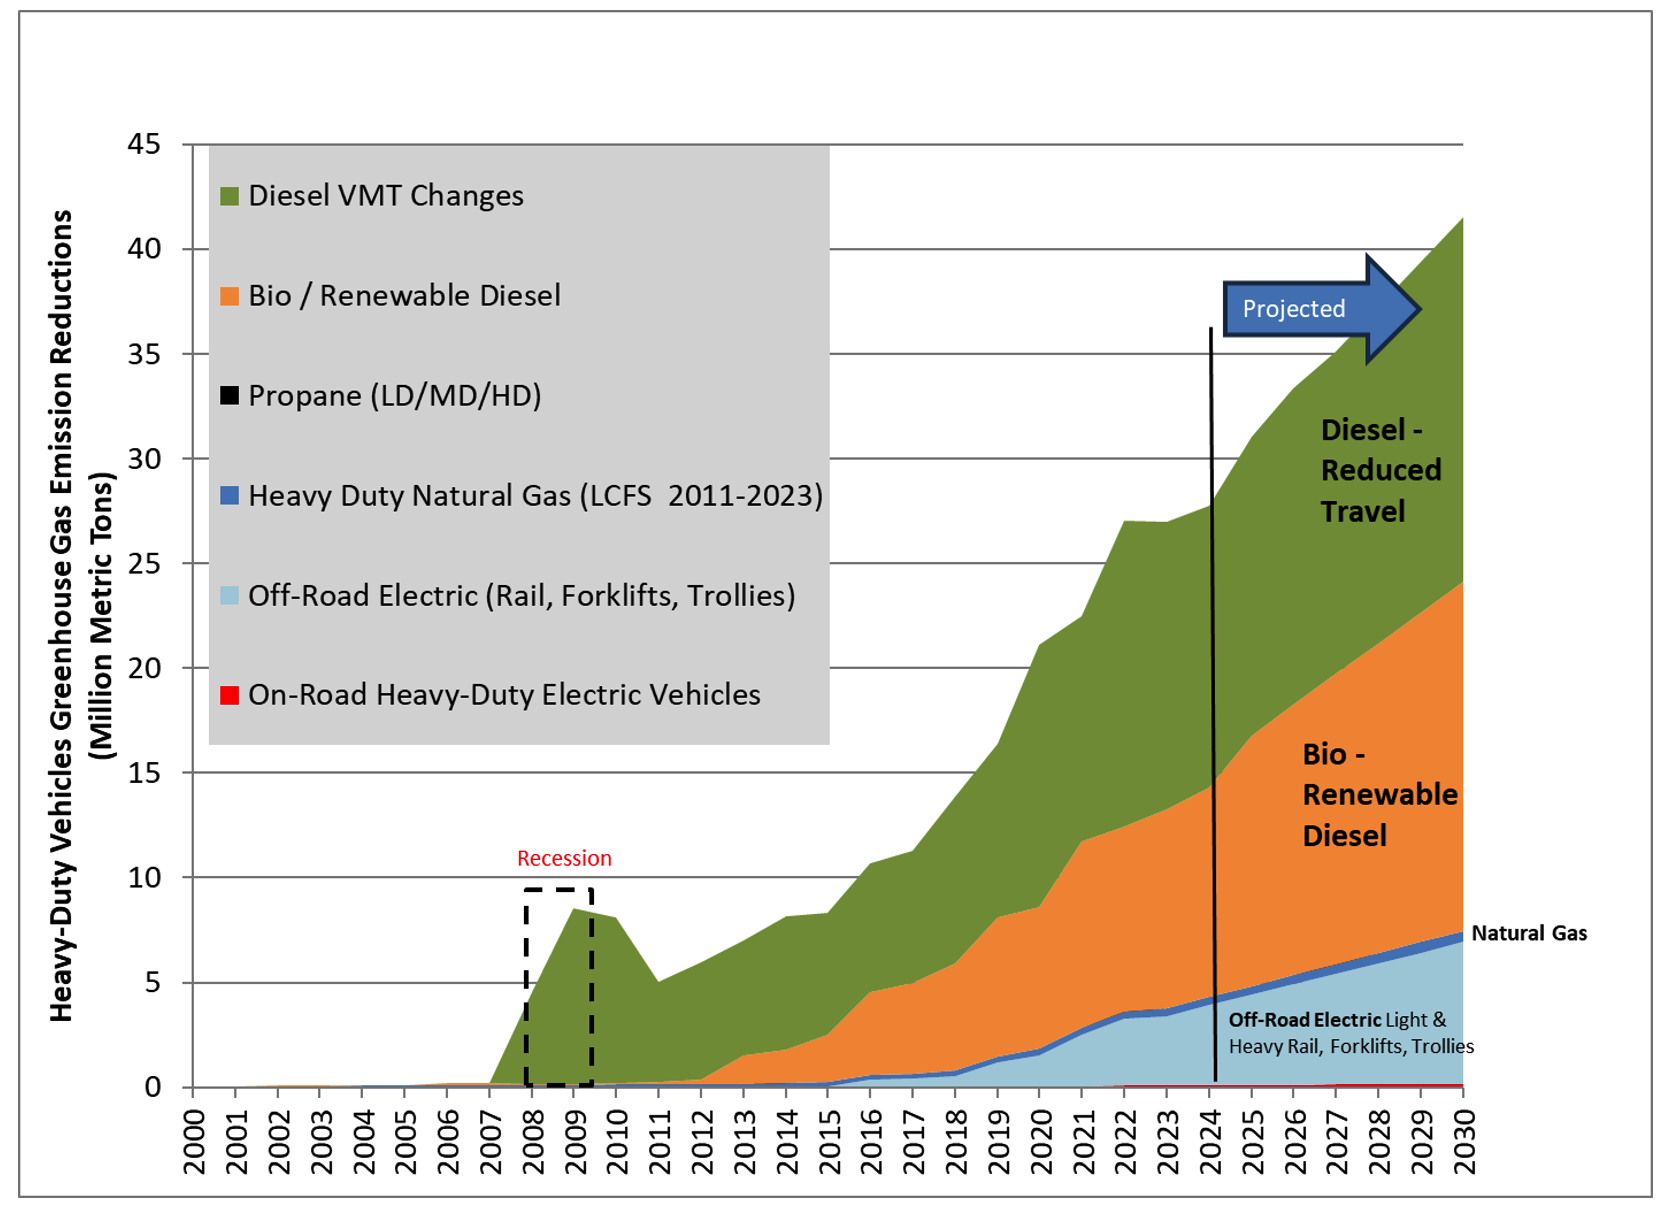
Sources: Stillwater analysis of CEC-DMV Registered Populations, LCFS Reporting Tool data, and the EPA Fuel Economy Guide
So what?
At Stillwater, we constantly monitor and update our comprehensive analysis of all fuel use and petroleum reduction factors to inform our work for clients. A key finding that consistently emerges concerning petroleum diesel and diesel related GHG reductions is that liquid fuel substitutes (BD and RD) displace petroleum and GHG emissions more rapidly than fleet turnover (i.e., new vehicle purchases). The transition from diesel to ZEVs for medium- and heavy-duty fleets will take time. In the meantime, biofuels will dominate petroleum and GHG reductions for several decades. The steep drop in diesel sales after the recession suggests a potential magnitude of California’s ZEV mandate. The future mandated significantly higher ZEV trucks and on-site rechargers may have a negative economic impact (demand destruction) for some businesses in the state further reducing future diesel demand, not yet shown. These insights help us refine our forecasts for different policies, regulations, and social changes. These insights help us improve the accuracy of our forecasts around various policies and regulations as well as social changes.
If you have a question about this analysis or how fuel use is likely to change in the coming years, contact us for a deeper dive into these issues.