What is displacing fossil gasoline in California? The answer may surprise you.
Link to article: https://stillwaterassociates.com/what-is-displacing-fossil-gasoline-in-california-the-answer-may-surprise-you/
February 9, 2024
By Gary Yowell
For over two decades, Stillwater has monitored the rate of fossil fuel consumption and associated greenhouse gas (GHG) emissions in California as well as the factors influencing these trends. As shown in Figure 1 below, California has reduced fossil fuel consumption in the state by 7.8 billion gallons compared to the projected trend (extrapolated from the historic trendline). Our ongoing analysis reveals that the main drivers of declining fuel use and GHG emissions are lower population growth, enhanced fuel efficiency, and the proliferation of renewable fuels. We discuss each of these factors and their temporal evolution in this article.
Figure 1. Gasoline Fuel Sales Trend (1950-2023)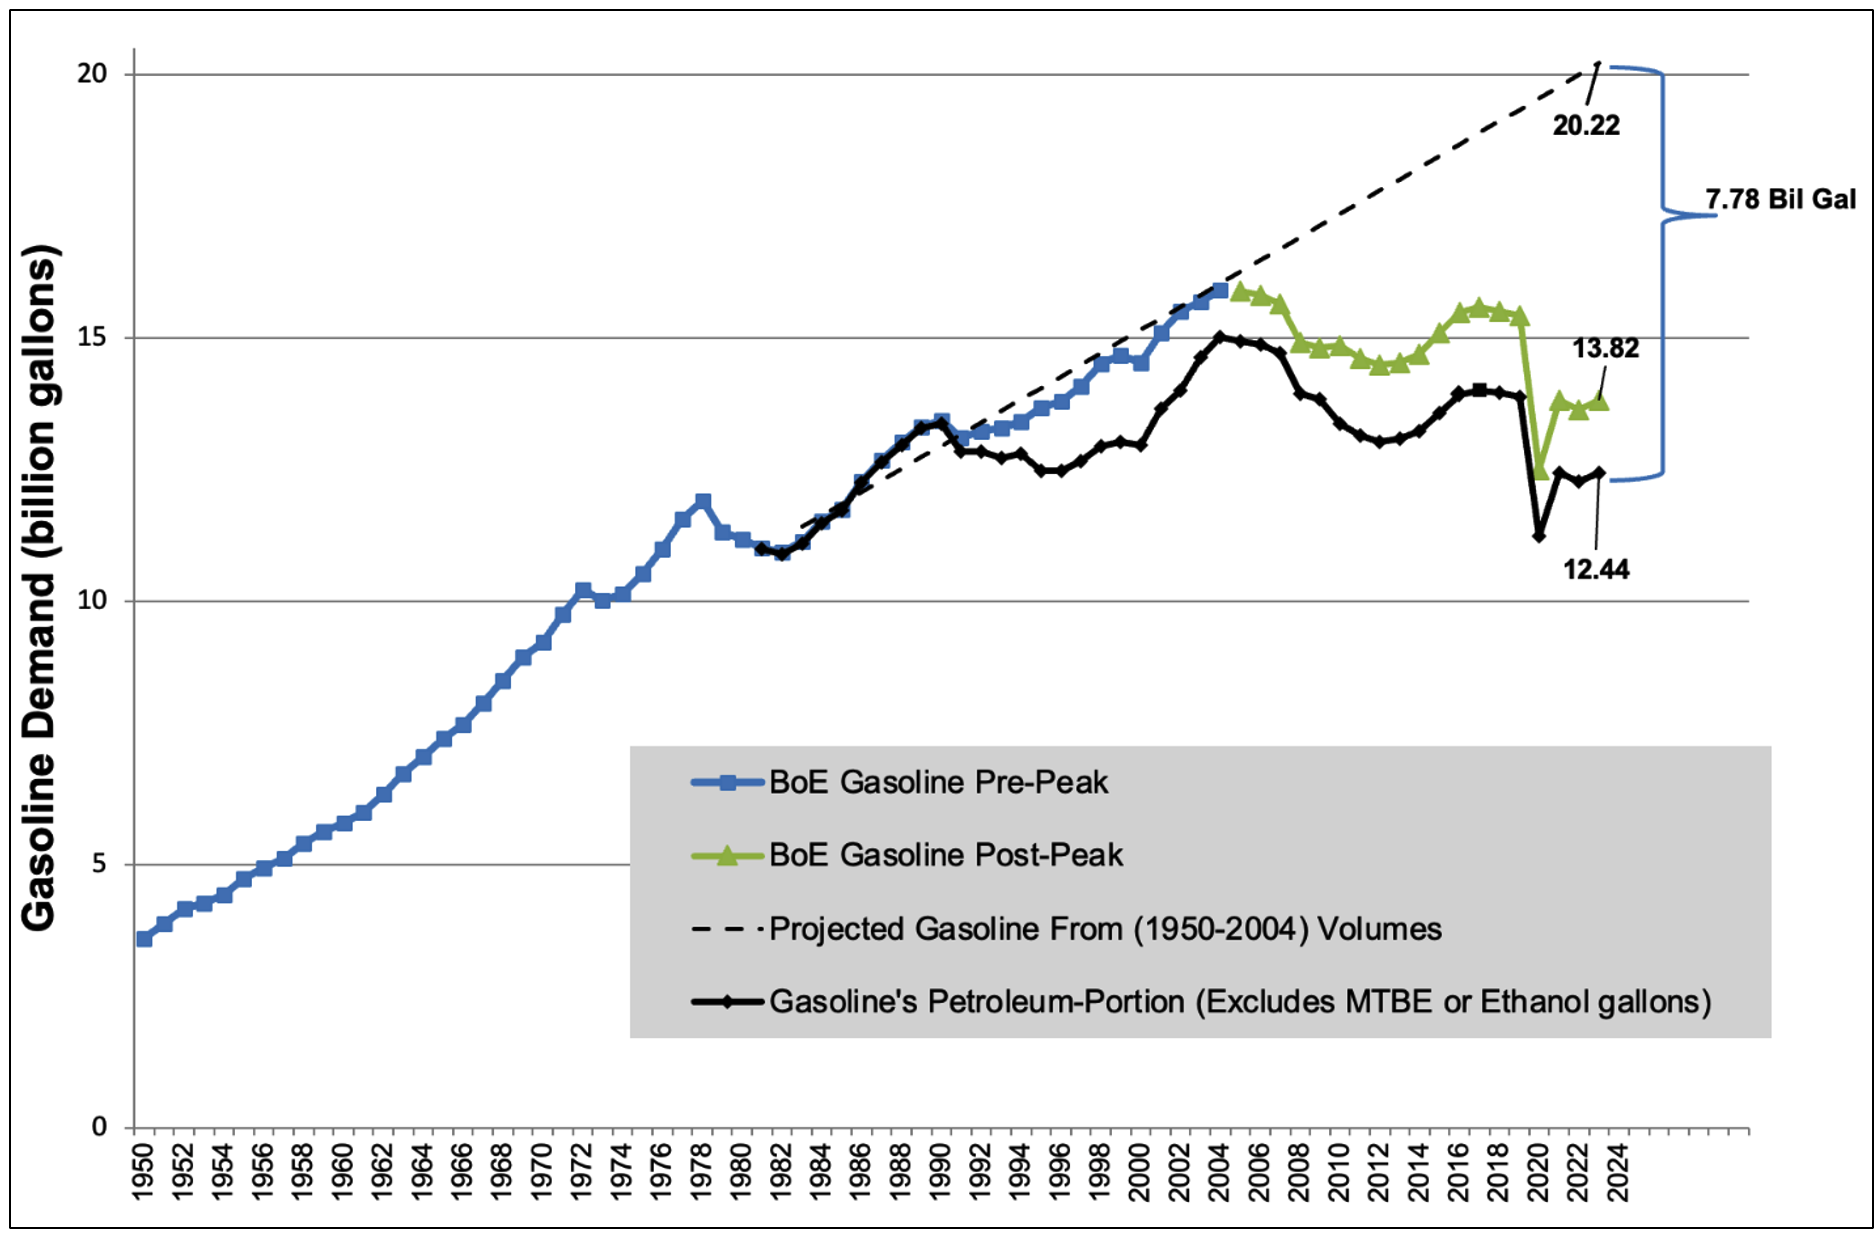 Source: Stillwater analysis of Board of Equalization taxable fuel sales and LCFS Reporting Tool data
Population Growth
California’s historic population growth (from 1940-2003) was the dominant factor for growth in gasoline sales from 1950-2000. The state’s population growth has slowed significantly since 2003. Based on Stillwater’s analysis of the California Department of Finance’s Population Estimates with Components of Change and Crude Rates, the average annual growth rate has fallen by 46% compared to the previous 60 years.
Fuel Efficiency
Figure 2, below, presents the factors contributing to petroleum reduction in California since 2000. High gasoline prices, which ticked upward beginning in 2003, directly resulted in stronger consumer demand for more fuel-efficient vehicles. The increase in purchases of higher fuel economy cars resulted in gasoline reductions before EPA’s 2011 higher fuel economy regulations started. As can be seen, the purchase of conventional vehicles with greater fuel economy since 2003 are responsible for a whopping 74% of all gasoline reductions.
Renewable Fuel
In 2000, methyl tert-butyl ether (MTBE) was the oxygenate additive blended with fossil gasoline used to comply with federal and state regulations for cleaner gasoline; but in the early 2000s MTBE was replaced by ethanol. Ethanol usage and increased fuel efficiency combined represent 87% of all petroleum reductions in 2023.
Other contributors
We note that sustained high fuel prices reduced overall vehicle driving in addition to incentivizing the purchase of more fuel-efficient vehicles (as described above). COVID also temporarily reduced driving and therefore gasoline use. The California Air Resources Board’s (CARB) zero emission vehicle (ZEV) mandate program requiring electric vehicles, hydrogen fuel cell vehicles (too small to be seen in the figure below), and plug-in hybrid electric vehicles are estimated to reduce 535 million gallons or nearly 7% of all gasoline reductions in 2023.
Figure 2. Trends in Gasoline-Reduction Factors
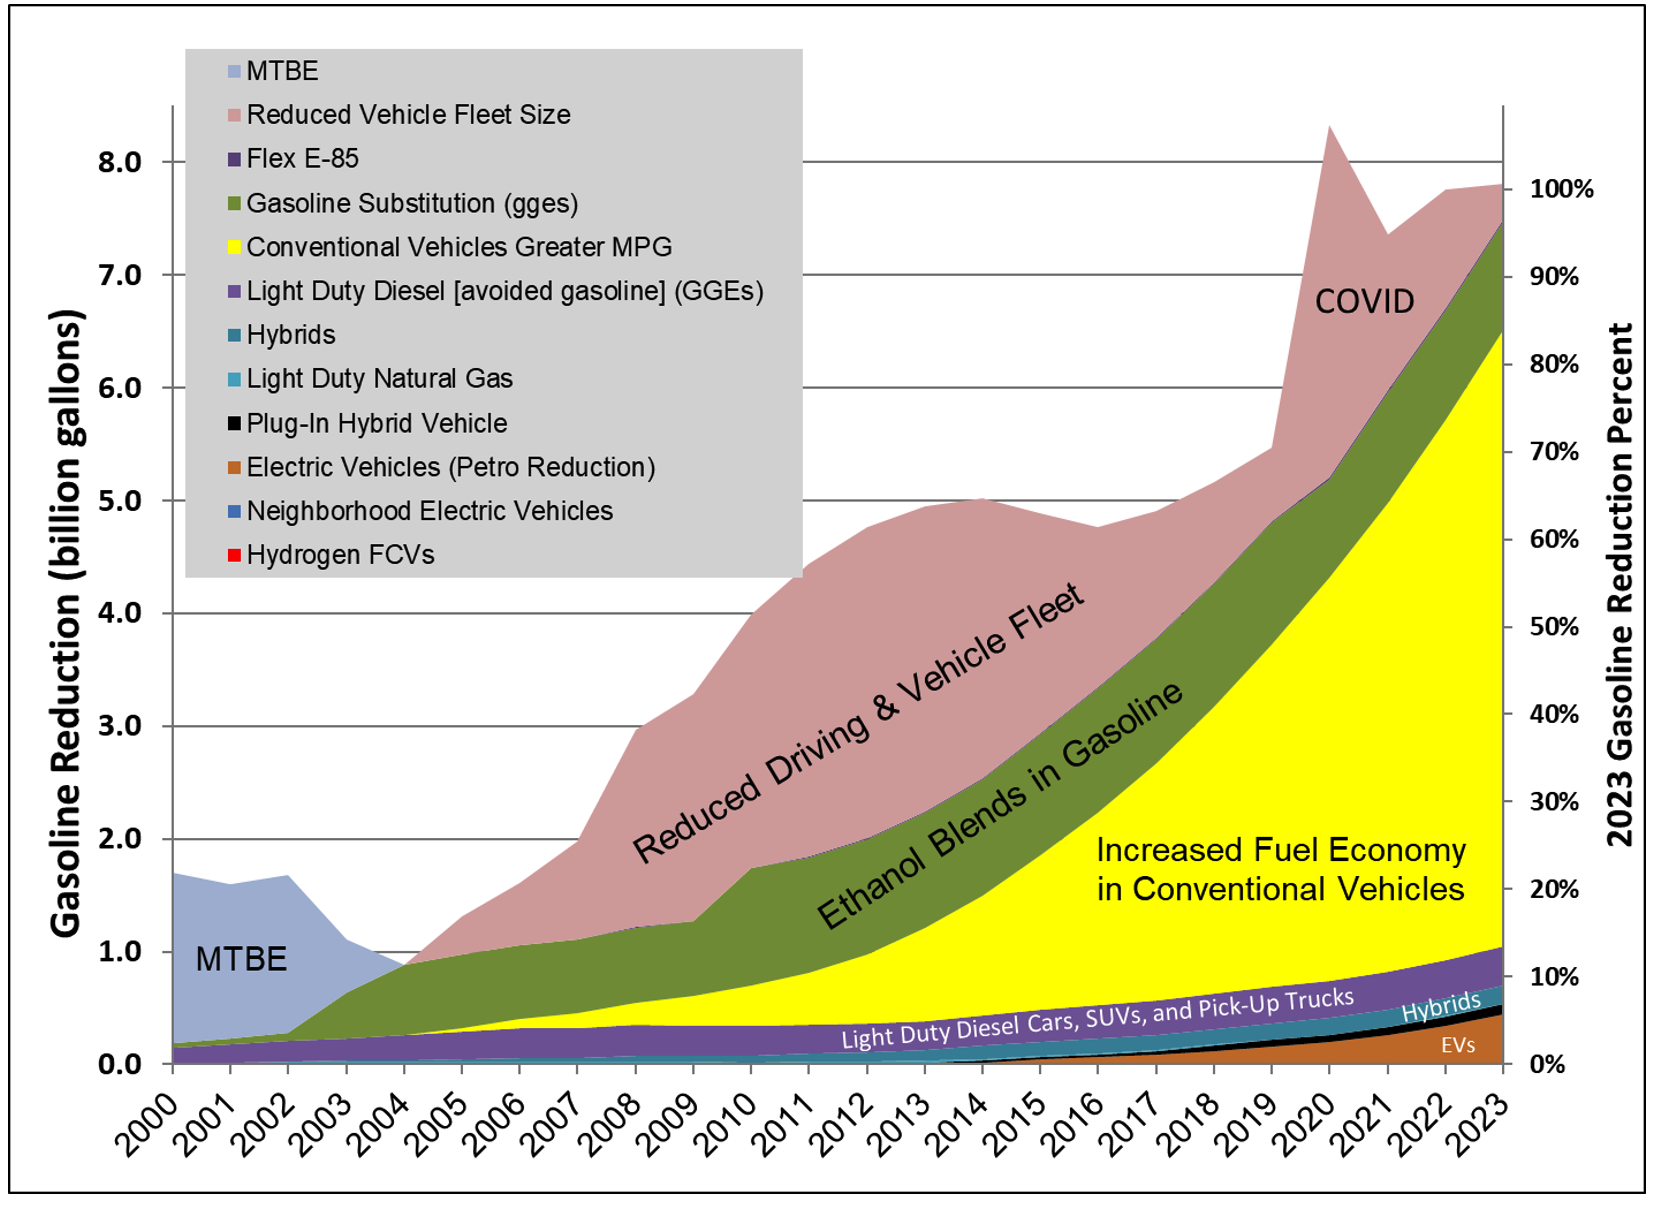 Sources: Stillwater analysis of CEC-DMV Registered Populations, LCFS Reporting Tool data, and the EPA Fuel Economy Guide
So what?
At Stillwater, we constantly monitor and update our comprehensive analysis of all fuel use and petroleum reduction factors to inform our work for clients. A key finding that consistently emerges concerning fossil gasoline reductions is that liquid fuel substitutes (i.e., MTBE and ethanol) displace petroleum more rapidly than fleet turnover (i.e., new vehicle purchases). But new vehicle transitions that occur in large volumes over the long term enhance and support biofuels in lowering petroleum fuel use. These insights help us improve the accuracy of our forecasts around various policies and regulations as well as social changes. Stay tuned for the next installment where we examine the diesel aspect of transportation fuel use. If you have a question about this analysis or how fuel use is likely to change in the coming years, contact us for a deeper dive into these issues.