Regulations Driving the Biofuels Feedstocks Markets
Link to article: https://stillwaterassociates.com/regulations-driving-the-biofuels-feedstocks-markets/
June 25, 2023
by Megan Boutwell, Olivier Macé, and Adam Schubert
The U.S. and Europe represent two of the largest biofuels markets globally, with policies in both regions driven to varying degrees by environment, energy security, and agricultural interests. The implementation of these policy objectives varies significantly between the regions due to differences in government structures.
A practical effect of the differences between U.S. and European approaches to biofuels policies manifests in the implementation of preferences, prohibitions, incentives, and penalties applied to the use of different feedstocks. These considerations have impact at both the EU and member state level in Europe and at the national and state level in the U.S. An important result of these differences emerges in different market values for feedstocks and finished biofuels between Europe and the U.S. and the practical impacts those valuation differences place on trade in those commodities.
In this article, we provide background information on how policies affect the value of different biofuels in the U.S. and Europe.
U.S. Policy
Since the 1970’s, the U.S. has utilized a number of policy incentives to promote the production and use of biofuels. Policy justifications for this support have varied over time but have included support for domestic agriculture, promotion of energy independence and energy security through reductions in petroleum imports, reductions in criteria pollutant emissions from transportation, and reduction in greenhouse gas (GHG) emissions. Policy tools which have been employed include excise tax credits for biofuels blending, biofuels blending mandates, tariffs on imported biofuels, loan guarantees to support investment in biofuels production, grants to support biofuels research and development, and grants to support investment in biofuels retail and distribution infrastructure. Additional support has been in the form of public service advertising campaigns promoting the benefits of biofuels.
Biofuel policy incentives have generally been offered at the federal and state levels with state-level incentives commonly focused on support for in-state production and use of biofuels and, in recent years, climate change mitigation programs. For the purposes of this article, we will limit our discussion to the elements of these policies which focus on feedstocks.
The RFS drives agricultural and waste feedstock use
Established by the Energy Independence and Security Act of 2007 (EISA 2007), the federal Renewable Fuel Standard (RFS) establishes four nested annual renewable fuel volume obligations, each defined by parameters around applicable feedstocks, minimum GHG-reduction requirements, and usage. The four categories are:
- Renewable Fuels – The broadest of the four categories, it encompasses fuels produced from renewable biomass which are determined to offer a minimum 20% GHG reduction compared to the petroleum-based fuels which they displace. The term “renewable biomass” is defined very broadly but excludes crops grown on land which was forested, not cleared, or not under cultivation at the time of enactment and planted trees and tree residues from federal lands.
- Advanced Biofuels – A subset of the Renewable Fuels category with a more stringent 50% GHG-reduction requirement. Notably, ethanol produced from corn starch is specifically excluded from this category.
- Biomass-based Diesel – A subset of the Advanced Biofuels category restricted to fuels used to displace diesel fuel, jet fuel, or home heating oil.
- Cellulosic Biofuels – A subset of the Advanced Biofuels category restricted to fuels which achieve a minimum 60% GHG reduction and which are produced from cellulose, hemicellulose, or lignin.
While the RFS intentionally includes a wide range of potential feedstocks, it makes those fuels which meet the more stringent feedstock type and GHG reduction categories more valuable in the market. With this structure, waste-based biofuels receive more favorable treatment as they are not burdened with the indirect land use change (ILUC) factors assigned to crop-based biofuels as part of the GHG reduction assessments.
IRA tax credits incentivize low carbon intensity feedstocks
The Inflation Reduction Act of 2022 (IRA) includes a number of tax credit provisions intended to incentivize actions to combat climate change. The three provisions directly relevant to biofuel feedstocks are:
- Biodiesel and Renewable Diesel Blenders Tax Credit (BTC) – This tax credit, which has been in place for many years, but was set to expire at the end of 2022, is extended through 2024 by the IRA. The BTC offers a $1.00/gal tax credit to parties blending qualifying biofuels (biodiesel and renewable diesel) with petroleum diesel. The BTC contains no restrictions on feedstocks utilized or minimum GHG reductions.
- Sustainable Aviation Fuel (SAF) Credit – This tax credit is newly-established with the IRA, is applicable for 2023 and 2024, and offers SAF blenders a tax credit of $1.25 to $1.75/gal for qualifying SAF blends. To qualify for the minimum $1.25/gal credit, the fuel cannot be derived from palm fatty acid distillates or petroleum and must have a lifecycle GHG reduction of at least 50% as determined by the CORSIA model (or any similar model approved by the Internal Revenue Service). Fuels achieving lifecycle GHG reductions of greater than 50% receive an additional $0.01/gal for every 1% improvement to a maximum $1.75/gal credit for fuels achieving a 100% GHG reduction. The minimum 50% GHG reduction threshold and use of the CORSIA model is expected to strongly discourage the use of crop-based feedstocks for SAF production.
- Clean Fuel Production Credit (CFPC) – This tax credit is newly-established with the IRA and replaces the BTC and SAF credits when they both expire at the end of 2024. The CFPC is currently authorized through 2027. It is available to domestic producers of qualifying transportation fuels as opposed to the BTC and SAF Credits which are available to blenders of those fuels. Additionally, the CFPC is not available for fuels produced via co-processing with petroleum feedstocks or at facilities receiving the Clean Hydrogen (45V) or CCS (45Q) tax credits. The credit has a nominal value of $1.00/gal ($1.75/gal for SAF) which is pro-rated based on the fuel’s carbon intensity (CI) as determined by the GREET model (CORSIA model for SAF); qualifying transportation fuels are required to have a maximum CI of 50 kgCO2e/mmBTU and a CI of zero is required to earn the full credit amount. As a result, crop-based biofuels are expected to earn little, if any, CFPC credit.
State programs add further incentives to use agricultural feedstocks and drive down CI
State biofuel incentive programs were historically concentrated in the Midwest farm states and were designed to support in-state crop production and in-state biofuels production. More recently, with growing concern over climate change, progressive-leaning states have begun to consider and adopt Low Carbon Fuel (LCF) programs.
Traditional Biofuel Incentives
These incentives have existed for many years in Farm Belt states. They range from blending mandates, such as Minnesota’s per-gallon blend mandates for 10% ethanol blends in gasoline (E10) and 20% biodiesel in diesel (B20),(1) tax incentives such as Illinois’ sales tax exemptions for E10 gasoline and diesel blended with greater than 10% biodiesel (B11), and retail availability mandates such as Iowa and Nebraska laws mandating retail availability of 15% ethanol blends in gasoline (E15). These incentives do not specify feedstocks but are generally met with corn ethanol and soy biodiesel as these are typically the lowest cost options.
A more recent development has been this year’s adoption of sustainable aviation fuel (SAF) blend incentives in Illinois, Washington, and Minnesota.
- Illinois – the incentive of $1.50/gal of SAF blended for use in Illinois limits the eligibility of soy-based SAF to 10 million gallons per year. Starting in June 2028, the credit is limited to domestic feedstocks.
- Washington – An incentive of $1.00/gal of SAF blended requires fuels to have at least 50% lower lifecycle GHG emissions than petroleum jet fuel with an additional credit of $0.02/gal for every additional 1% GHG reduction (to a maximum credit of $2.00/gal). This credit, however, does not become available until there are one or more in-state production facilities with a combined capacity of at least 20 million gallons per year. The 50% GHG reduction requirement is expected to limit the use of crop-based biofuels.
- Minnesota – An incentive of $1.50/gal of SAF requires a minimum 50% lifecycle GHG reduction per the GREET or CORSIA model. Eligible fuel must either be produced in Minnesota or blended in-state and used to fuel aircraft in-state. The 50% GHG reduction requirement is expected to limit the use of crop-based biofuels.
LCF Programs
State-level LCF programs have begun to proliferate in the U.S., initially in California, followed by Oregon, and most recently Washington state. Further, state legislatures in New Mexico, New York, Minnesota, Michigan, and Illinois all considered the establishment of LCF programs during this year’s sessions. As LCF programs incentivize reductions in the CI of the fuel pool, they effectively promote biofuels produced from waste-based feedstocks (e.g., used cooking oil and inedible tallow) over crop-based biofuels (e.g., corn and soybeans). Given the repeated consideration of LCF programs in state legislatures, it is expected that this type of program will grow to encompass additional states in the coming years, creating a patchwork of LCF programs across the U.S.
EU Policy favors waste and residue feedstocks
The main regulation at the European level driving the use of biofuels is the Renewable Energy Directive, currently in its second 10-year cycle (REDII) but due to be replaced within the next 18 months by a new and more ambitious version (REDIII).
Both REDII and its successor REDIII establish a precise categorization of feedstocks, with different levels of incentives or restrictions driven by a clear policy intent to favor the use of wastes and residues, and conversely to limit the use of food crops. Future regulations covering the use of biofuels and low carbon fuels in Aviation (“ReFuel EU Aviation”) and in Shipping (“FuelEU Maritime”) are due to start in 2025 and will also establish a distinction between feedstock categories.
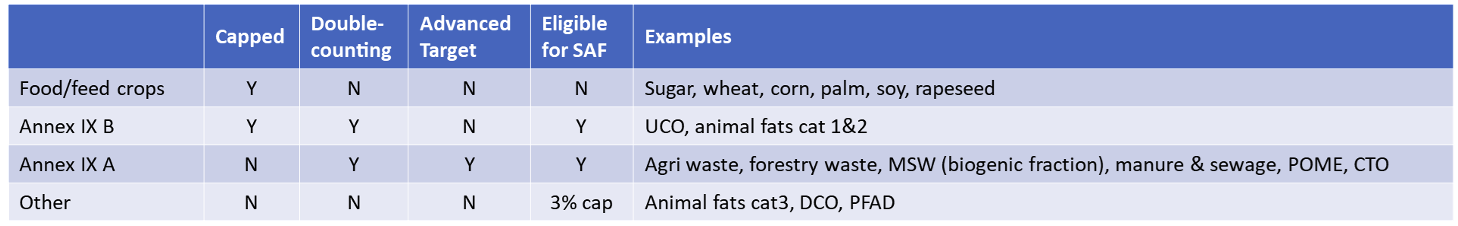
Essentially, feedstocks for biofuels production within the EU are divided into four categories:
- Food and (animal) feed crops: This covers all sources of edible carbohydrates for ethanol production (sugars and grains) and all edible oils (soybean, palm, canola etc.). Least favored by the regulation, this category is capped at 7% of the total obligated energy, and so-called “high iLUC” feedstocks are due to be phased out within the next few years. This high iLUC criteria applies in particular to palm oil, although some are pushing for soybean oil to be included in the phase-out.
- Waste & Residues with no cap (listed in Annex IX part A of RED): Also referred to as “Advanced” feedstocks, these receive the highest level of incentive as they are both eligible for double-counting (energy content counted twice for the fulfillment of blending obligations) and the subject of a nested Advanced sub-target which increases over time (in REDIII, equivalent to 4.5% by energy content in 2030).
- Waste & Residues with cap (Annex IX part B): This list currently has only two raw materials – used cooking oil (UCO) and animal fats (categories 1 & 2). They are partly incentivized as they are eligible for double-counting, but they are also restricted by a cap of 1.7%, originally introduced in REDII largely due to concerns about possible fraud / misclassification. Crucially, both parts of the Annex IX are also likely to be the main feedstocks for the future SAF mandate (ReFuel EU Aviation), providing another strong demand pool for them.
- Any feedstock which isn’t listed above (i.e., is neither a food/feed crop nor included on the Annex IX list part A or B): Important feedstocks on this list include category 3 animal fats, distillers’ corn oil (DCO), palm fatty acid distillate (PFAD) and others. These are neither capped, nor incentivized by double-counting or an Advanced sub-target. The SAF mandate will allow a small part of the mandate (capped at 3%) to be met with feedstocks of this type.
The table below summarizes the different categories of feedstocks in the European Union, with their particular benefits or restrictions.
EU Feedstock Incentives
Ultimately, valuation of biofuels based on feedstocks depends on a combination of the classification – as per the above – and the CI of the final biofuel grade, with more EU Member States expected to switch to a GHG reduction target in their implementation of REDIII. Schematically, the figure below shows the relative ranking of the different feedstock categories based on the level of incentives available.
Feedstock Rankings Based on Available EU Incentives

As of this writing, the all-important RED Annex IX is undergoing a review, with an early draft indicating the possibility of several important additions to both part A and part B. Notably, part A could include “non-food crops grown on severely degraded land, not suitable for food and feed crops.” Part B may see several additions including “intermediate crops, such as catch crops and cover crops…” which would therefore be eligible for SAF production. In a market where lipid feedstock tightness for production of renewable diesel (HVO) and SAF (HEFA) is a growing concern, and with future SAF demand potentially overtaking all other biofuels, the inclusion of cover crops such as carinata, camelina, or pennycress could prove to be a game-changer in Europe.
EU member states’ feedstock regulations add complexity
To add to the complexity of the European picture, individual member states within the EU have taken their own approach to feedstock restrictions, with several going further than the Union in imposing caps or bans. It would take too long to list all these national differences, but the list below is illustrative for our purposes:
- Some countries have adopted a lower cap on food crops (e.g., Germany at 4.9%).
- Palm oil is banned de facto in several countries (e.g., Netherlands). Both palm and soybean oil are banned in France.
- Animal fat category 3 is banned in Germany.
- Germany also disqualifies the co-processing of fats and oils in conventional refineries.
- Part A item (g) (palm oil mill effluent and empty palm fruit bunch or POME & EPFB) is excluded from the Advanced list for double-counting of carbon credits in Germany
Finally, some important European markets (e.g, the UK, Norway, and Switzerland) are outside the EU, and they are free to take their own approach to feedstock classification. The UK’s historical membership in the EU means that they have largely been using the same logic for feedstock categories (and double counting). Norway also tends to follow the Annex IX list closely. Nevertheless, navigating the maze of specific feedstock regulations across multiple European countries can prove difficult, and this is not helped by the fact that some countries (e.g., France or Spain) have an annual cycle of updating their biofuel targets and regulations such that new provisions regarding feedstocks can appear at short notice.
Market participants must pay attention to the wide array of feedstock regulations
Tariff barriers have received considerable attention as to how they limit biofuels trade between Europe and the U.S. As discussed above, however, differences in feedstock aspects of biofuels policies between these markets represent substantial non-tariff barriers on trade in biofuels and biofuel feedstocks. Market participants are advised to pay close attention to these important policy differences in formulating their participation strategies in specific markets.
Looking for advice on policy considerations around biofuels in the U.S. and Europe? Contact Stillwater to learn more.
(1) This mandate is reduced to 5% during winter months due to cold flow concerns during Minnesota winters.

Get expert insights on LCFS, CFP, BC-LCFS, and RFS credit prices.
Stillwater’s Carbon Market Outlooks help fuels producers and investors cut through the noise, navigate carbon market uncertainty, and plan for the future.
Preview a sample report