A Tale of Two RINs – Digging Deeper
Link to article: https://stillwaterassociates.com/a-tale-of-two-rins-digging-deeper/
November 28, 2023
In our recent article, “A Tale of Two RINs,” we reviewed current conditions driving the price of D3 renewable identification numbers (RINs) upwards while the price of D4 RINs is falling. This article drew considerable interest. With respect to our analysis of the D4 RIN market, one of our readers agreed with our observation that the supply of D4 RINs was growing more rapidly than demand but suggested that we should dig a bit deeper to paint a more complete picture. In this article, we will provide additional analysis while updating with the most recent data from the U.S. Energy Information Administration (EIA) and Environmental Protection Agency (EPA).
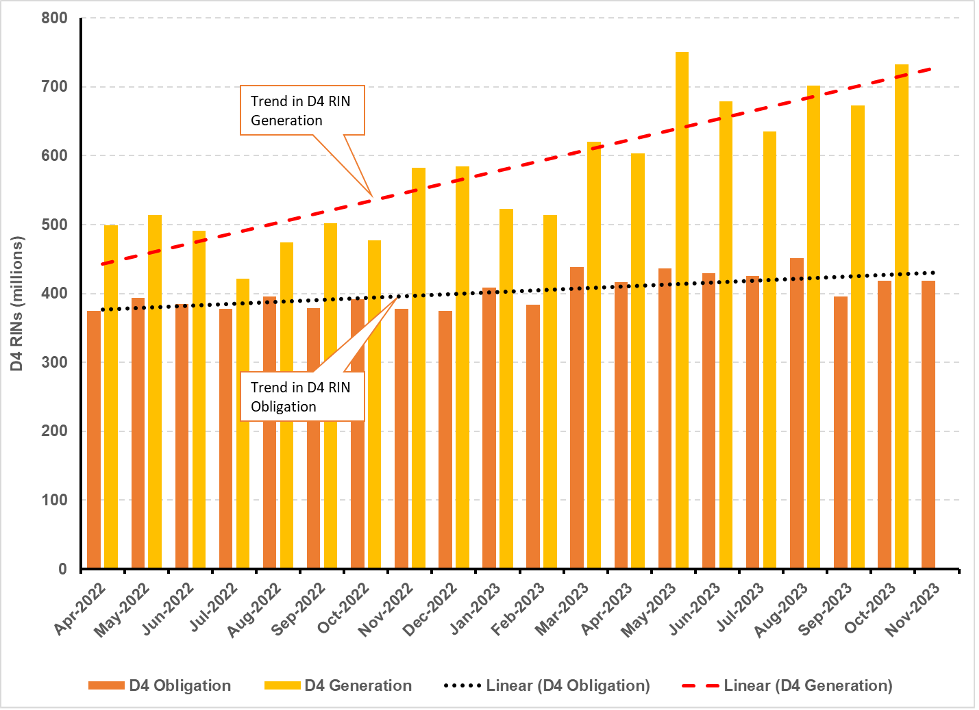
To start with, we reprise Figure 2 from our prior article with the addition of more updated data. This figure shows us that monthly generation of D4 RINs is growing more rapidly than the D4 renewable volume obligation (RVO). This is occurring due to continuing growth in U.S. renewable diesel (RD) production. This trend is expected to continue into, at least, 2024 with additional capacity nearing completion. However, as our reader noted, there is more to the story.
Figure 2. D4 RIN Obligation and Generation (April 2022 through November 2023)
To get to the next layer in understanding the balance of supply and demand for D4 RINs, there are two additional factors that need to be considered – D4 RIN demand and D4 RIN supply.
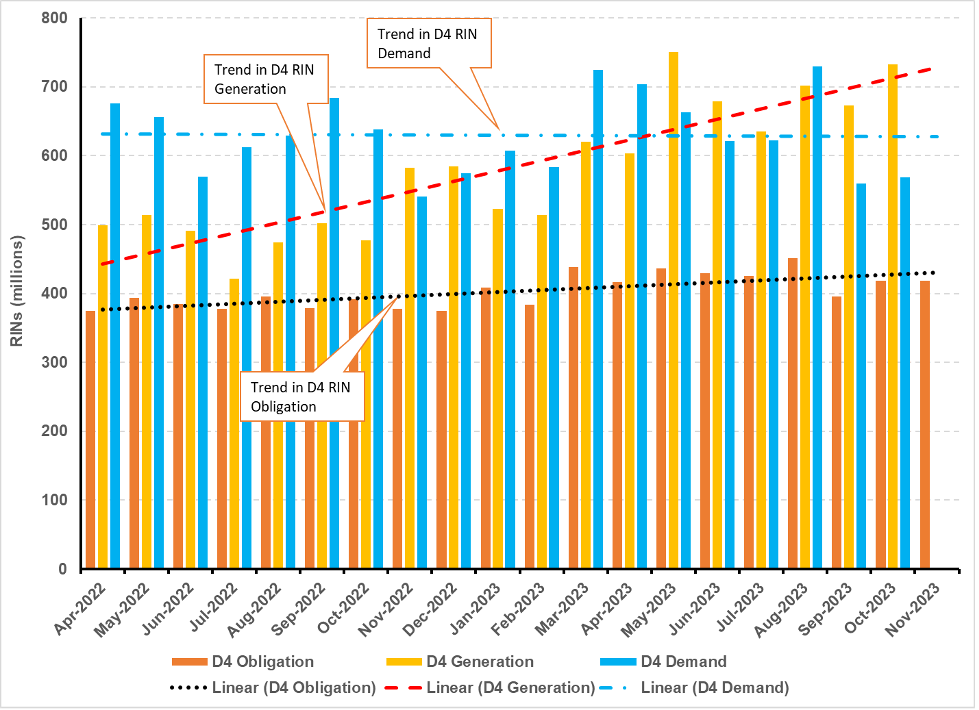
D4 RIN Demand – In addition to being used to satisfy the Biomass-Based Diesel (BBD) obligation, D4 RINs are also used to satisfy the portion of the undifferentiated Advanced Biofuel obligation which exceeds the availability of D5 RINs and to satisfy the portion of the Conventional Biofuel obligation which exceeds the availability of D6 RINs. In Figure 2A below, we add the light blue bars which represent all sources of D4 RIN demand. As seen in the graph, total D4 RIN demand is significantly higher than just the D4 RVO. While total D4 RIN demand is flat to slightly declining over this time period, the rate of D4 RIN generation did not exceed this demand until May of this year.
Figure 2A. D4 RIN Obligation, Demand, and Generation (April 2022 – Nov. 2023)
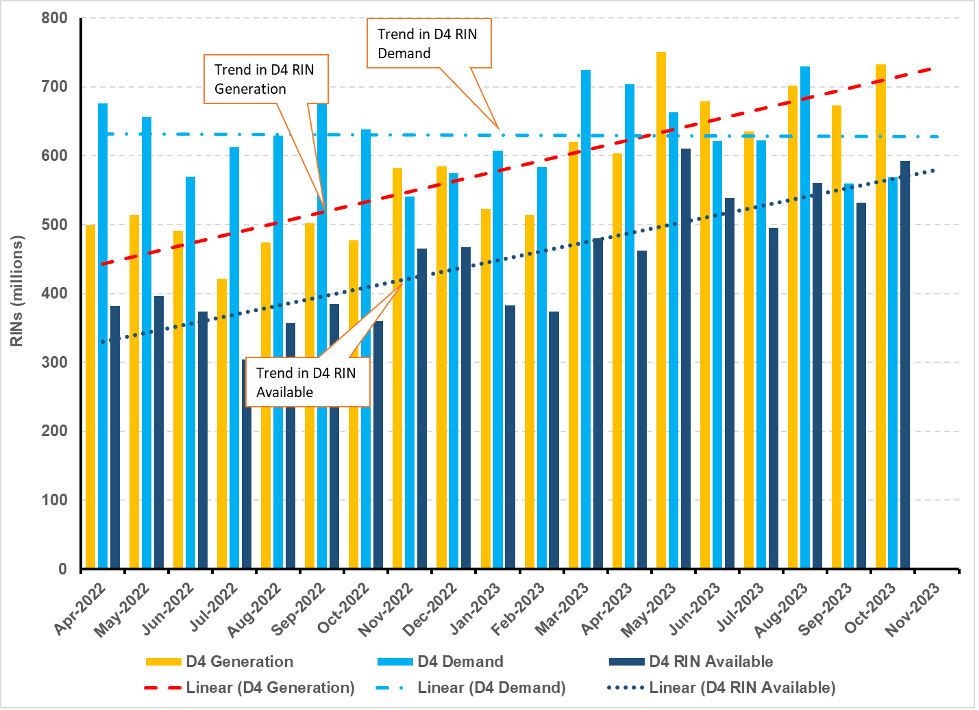
D4 RIN Supply – In addition to considering the number of RINs generated, we must also consider those RINs which are retired for reasons other than compliance with RVOs. This includes RINs retired when the associated fuels are exported as well as RINs associated with fuels used for ineligible purposes, spills, contaminations, RIN generation errors, volume corrections, etc. The actual RIN retirements associated with these circumstances can vary considerably from month to month, and EPA only reports them on a calendar year basis. In Figure 2B we estimate monthly D4 RIN availability by subtracting D4, D5, and D6 RINs retired due to exports (93 million per month in 2022, 106 million per month in 2023 year-to-date) and for all other reasons (24 million per month in 2022, 35 million per month in 2023 year-to-date). This adjusted calculation of D4 RIN Availability is included as the dark blue bars. (To simplify the chart, we have deleted the data for the D4 Obligation which appeared in Figures 2 and 2A.) In Figure 2B, we can see that, while D4 RIN Availability is steadily increasing, it is only now beginning to surpass our estimate of D4 RIN Demand. The net result is that the D4 RINs supply is expected to remain tight in 2023 but can be expected to grow increasingly surplus in 2024.
Figure 2B. D4 RIN Demand, D4 RIN Generation, and D4 RIN Availability (April 2022 through November 2023)
In summary: It can be difficult to assess whether this is the best of times or the worst of times for your RIN portfolio without digging below the surface of the regulations and market fundamentals. Over the longer term, we expect that RIN markets will find their way to bringing supply and demand into balance, but this process is complicated by the cycle of EPA’s RVO rulemakings, the impacts of state-level renewable and low-carbon fuel requirements, and the impacts of international trade.
If you are looking for further insights into the RFS, contact us here. We also produce an annual RINs outlook report providing a quantitative analysis of the market conditions that drive RINs prices including an overview of the RFS program, historical credit volumes and pricing, and a RINs price outlook through 2035. You can learn more about Stillwater’s outlook offerings here