A Tale of Two RINs
Link to article: https://stillwaterassociates.com/a-tale-of-two-rins/
November 7, 2023
It is the best of times (for buyers of D4 RINs and sellers of D3 RINs) and the worst of times (for buyers of D3 RINs and sellers of D4 RINs). Several recent news articles have been published concerning the “RIN Cliff” – the rapid fall in D4 RIN prices which has been recently observed; fewer stories have appeared concerning the recent run-up in D3 RIN prices which is also occurring. In this article, we will briefly review the relevant market forces behind both trends.
To begin, we start with D3 and D4 RIN price data as reported by OPIS since the second quarter of 2022 as shown in Figure 1 below. (Note that these are “current year” RIN prices, so 2022 vintage through 12/31/2022 and 2023 vintage starting 1/1/2023.)
- D3 RIN Prices – These RINs showed significant volatility in the eight months prior to EPA announcing the proposed Set Rule for 2023, 2024, and 2025 (the “Set Rule”) on December 1, 2022. There was a small blip in prices at the time of the announcement followed by a sharp drop with the transition between 2022 and 2023 vintage RINs on 1/1/2023. This drop-off reversed with the announcement of the final Set Rule on June 21, 2023. Prices then held relatively steady, dipped to a low on September 18th, and then began a steady march upward.
- D4 RIN Prices – These RINs were on an upward ramp prior to the announcement of the proposed Set Rule. Prices dropped sharply on the announcement then began a downward drift leading to a smaller sell-off on the announcement of the final rule. Prices slowly recovered to a post-announcement high of 154.25 cents on July 25th before the start of a downward trend which accelerated after September 18th.
Figure 1. Current Year D3 and D4 RIN Prices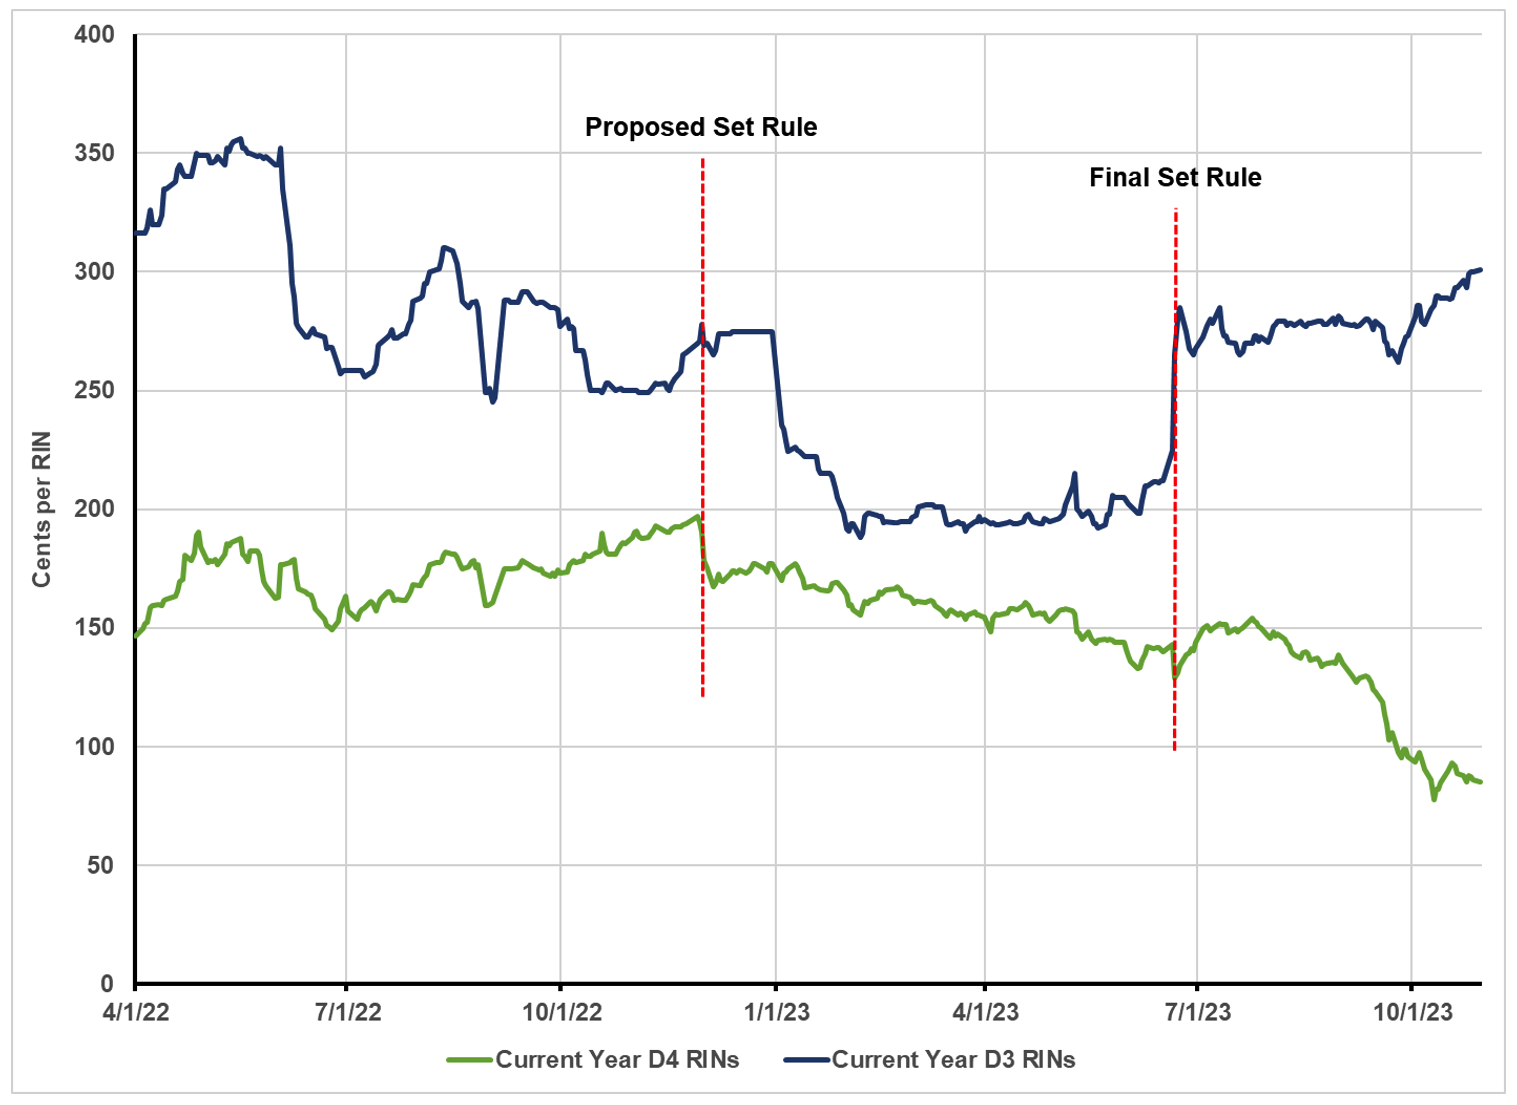
Sources: OPIS data and Stillwater analysis
The D4 “RIN Cliff”
D4 RIN prices, as shown in Figure 1, were varying between $1.50 and $2.00 prior to release of the proposed rule in December 2022. Most of this variation can be explained by trends in the BOHO spread – the soybean oil price minus heating oil price, a widely used proxy for the difference between the market price of biodiesel (BD) and ultralow sulfur diesel (ULSD). Prices dropped sharply on release of the proposed rule as EPA did not increase the proposed biomass-based diesel (BBD) obligation as much as the market was expecting. With rapidly growing production of renewable diesel (RD), a more significant increase in the proposed renewable volume obligation (RVO) would be needed to assure demand for all the expected production. D4 prices were also impacted by the market’s interpretation of the proposed eRIN provisions; there was an expectation that the proposal would result in surplus D3 RINs which would compete in the market with surplus D4 RINs, driving down their price. When the market digested the final rule, published in June 2023, the market had a mixed reaction as there was a small increase in the BBD RVO from the original proposal, and the eRIN provisions were dropped.
Traditionally, we look for D4 RIN prices to follow the BOHO spread, adjusted for the BTC. This is based on market conditions where D4 RINs are in short supply and the price needs to rise to a level to support incremental BD production from soybean oil. This structure, however, ceases to be applicable in market conditions where D4 RINs are in surplus supply. The falling trend in D4 RIN prices since July can best be explained by looking at how the supply and demand balance has been evolving; this is presented in Figure 2 below.
Figure 2. Evolution of the D4 RIN Supply-Demand Balance
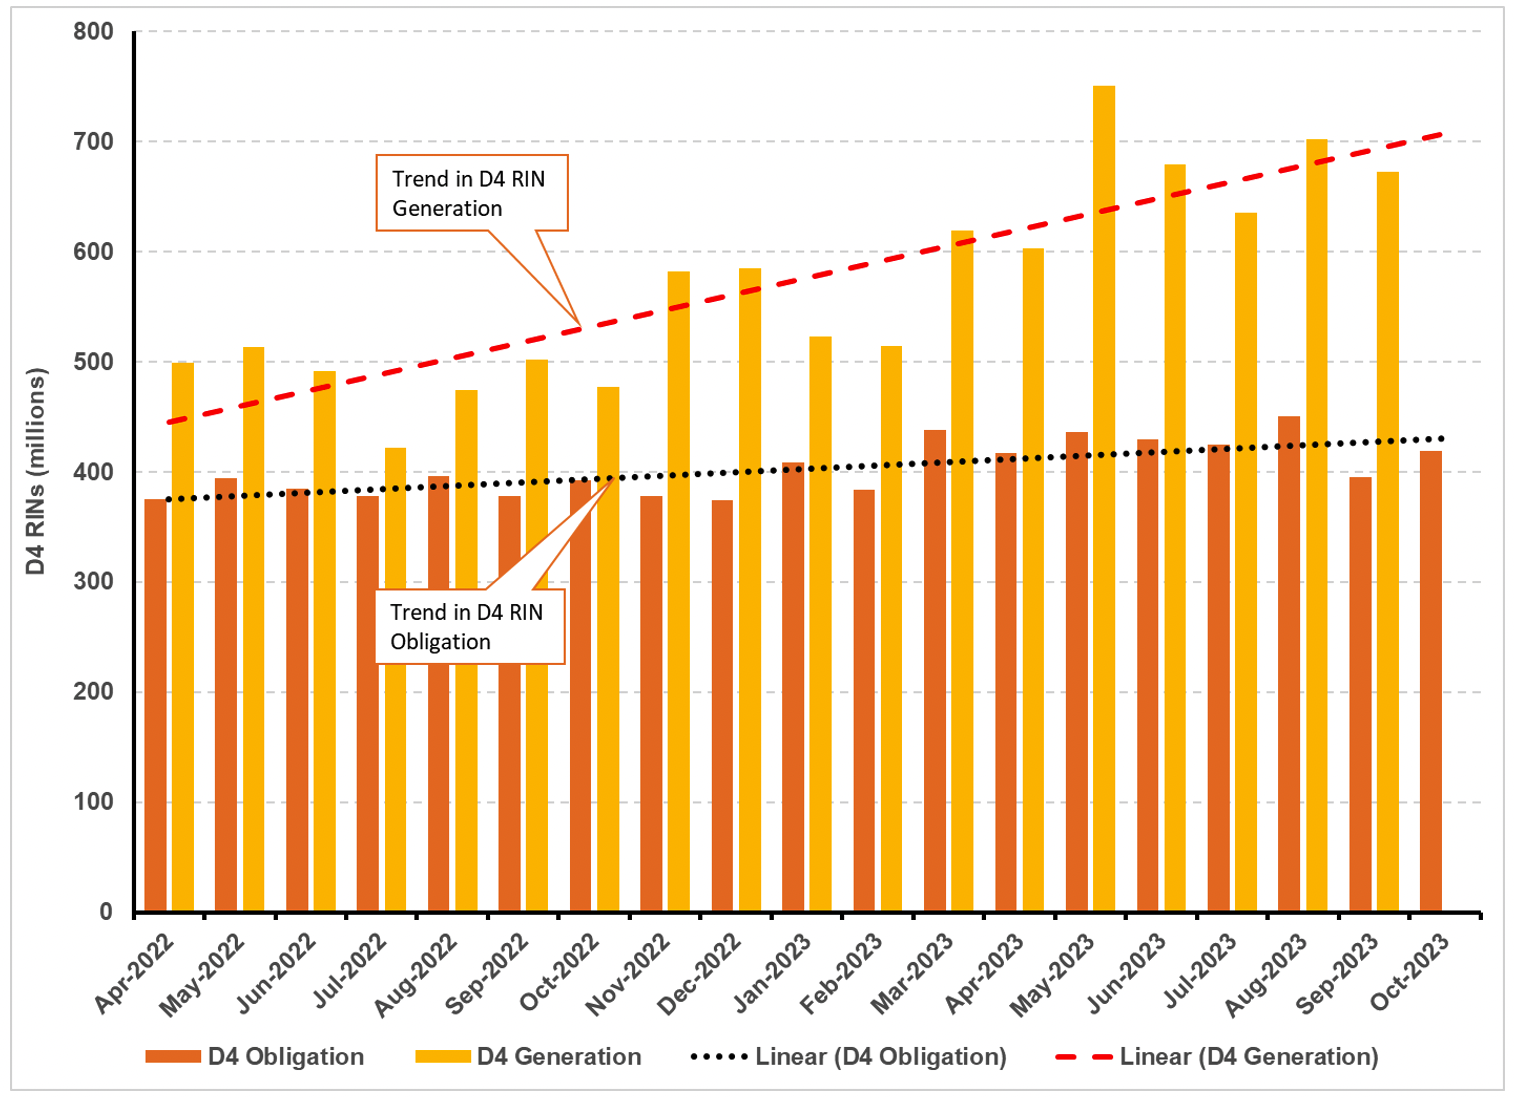
Source: EIA, EPA EMTS, Stillwater Analysis
In Figure 2, we estimate the monthly D4 RIN obligation by estimating U.S. market demand for petroleum gasoline and diesel by using EIA’s Petroleum Supply Monthly report (available through August 2023) supplemented by EIA’s weekly product supply estimates (for September and October) and multiplying the sum of the estimated gasoline and diesel volumes by the annual percentage standard (2.33% in 2022 and 2.58% in 2023). The supply of D4 RINs is estimated from the EPA Moderated Transaction System (EMTS) monthly RIN generation data (available through September with their October 10, 2023 update). The supply of D4 RINs has slightly outpaced the BBD obligation for the past several years, with the surplus consumed in covering shortfalls in the supply of D5 and D6 RINs. Figure 2 allows the trendline for D4 RIN demand, as seen by the black dotted line, to be compared to the trend in the D4 RIN supply, as seen by the dashed red line. As can be seen, the supply of D4 RINs is growing much more rapidly than the demand; this growing surplus in D4 RIN generation is likely the cause of the D4 “RIN Cliff.”
Closing this surplus in the near-term is likely to require BD and RD producers to curtail production. Over the longer term, this surplus tells us that there is room for EPA to increase the BBD RVO. As they have already finalized the RVOs through 2025, however, this is unlikely to happen in the near future, meaning that D4 RIN prices will likely be under pressure for some time.
The D3 RIN Shortfall
The situation with D3 RINs is quite different than that described above for D4 RINs. D3 RIN prices also dropped sharply with the proposed Set Rule in December 2022, but this drop was only really seen in the 2023 vintage D3s as the 2022 vintage D3s would all be expired before the then-proposed introduction of eRINs in 2024 (recall that, in Figure 1, prices through December 31, 2022 are for 2022 vintage and prices starting on January 1, 2023 are for 2023 vintage RINs). This price drop was reversed with the issuance of the final Set Rule in June 2023 which dropped the eRIN provisions. D3 RIN prices then varied in a relatively narrow range through September 2023 before starting on an upward trend.
Figure 3 below shows the supply-demand balance for D3 RINs and paints a much different picture than what we saw for D4s. For April through November of 2022, the estimated D3 obligation and D3 generation are nearly in balance. The large jump in D3 RIN generation seen in December 2022 followed by a drop to near-zero generation in January 2023 appears to be due to producers drawing down their inventories to accelerate generation from January 2023 into December 2022 (similar behavior can be observed in prior years.); the average of the two months is consistent with the overall trend. Starting in January 2023, the percentage standard for Cellulosic Biofuels increases from 0.35% to 0.48%, causing a significant step increase in the D3 obligation while supply has only increased slowly and unevenly. Thus, instead of the growing surplus which we see in the D4 market, the D3 market has a growing shortfall. It is reasonable to believe that this shortfall is the primary contributor to the steady growth of D3 RIN prices observed in recent months. Closing this gap under current regulations may prove to be difficult as nearly all D3 RINs are derived from renewable natural gas (RNG) and RNG only earns RINs if used to fuel natural gas vehicles (NGVs). Currently, the fuel supply to U.S. NGVs has almost completely transitioned to RNG and the NGV population is only growing slowly. This challenge was part of the impetus for EPA’s attempt to implement the eRIN provisions which were ultimately withdrawn from the final Set Rule. It is likely that EPA is working through the eRIN issues which were raised in comments on their proposed Set Rule, and a revised eRIN proposal may be coming in the not-too-distant future.
Importantly, D3 RIN prices have historically had a price ceiling set by the option for obligated parties to comply with their Cellulosic Biofuels RVO through the purchase Cellulosic Waiver Credits (CWCs) at a statutory formula price calculated annually by EPA. With the implementation of the Set Rule for 2023, 2024, and 2025, CWCs are no longer available as a compliance alternative; thus, there is no longer a specific price ceiling on D3 RINs. We don’t believe that EPA will, as a practical political matter, be able to allow D3 RIN prices to soar unbounded without taking some remediating action, but we don’t have a view on where the limit might be.
Figure 3. Evolution of D3 RIN Supply-Demand Balance
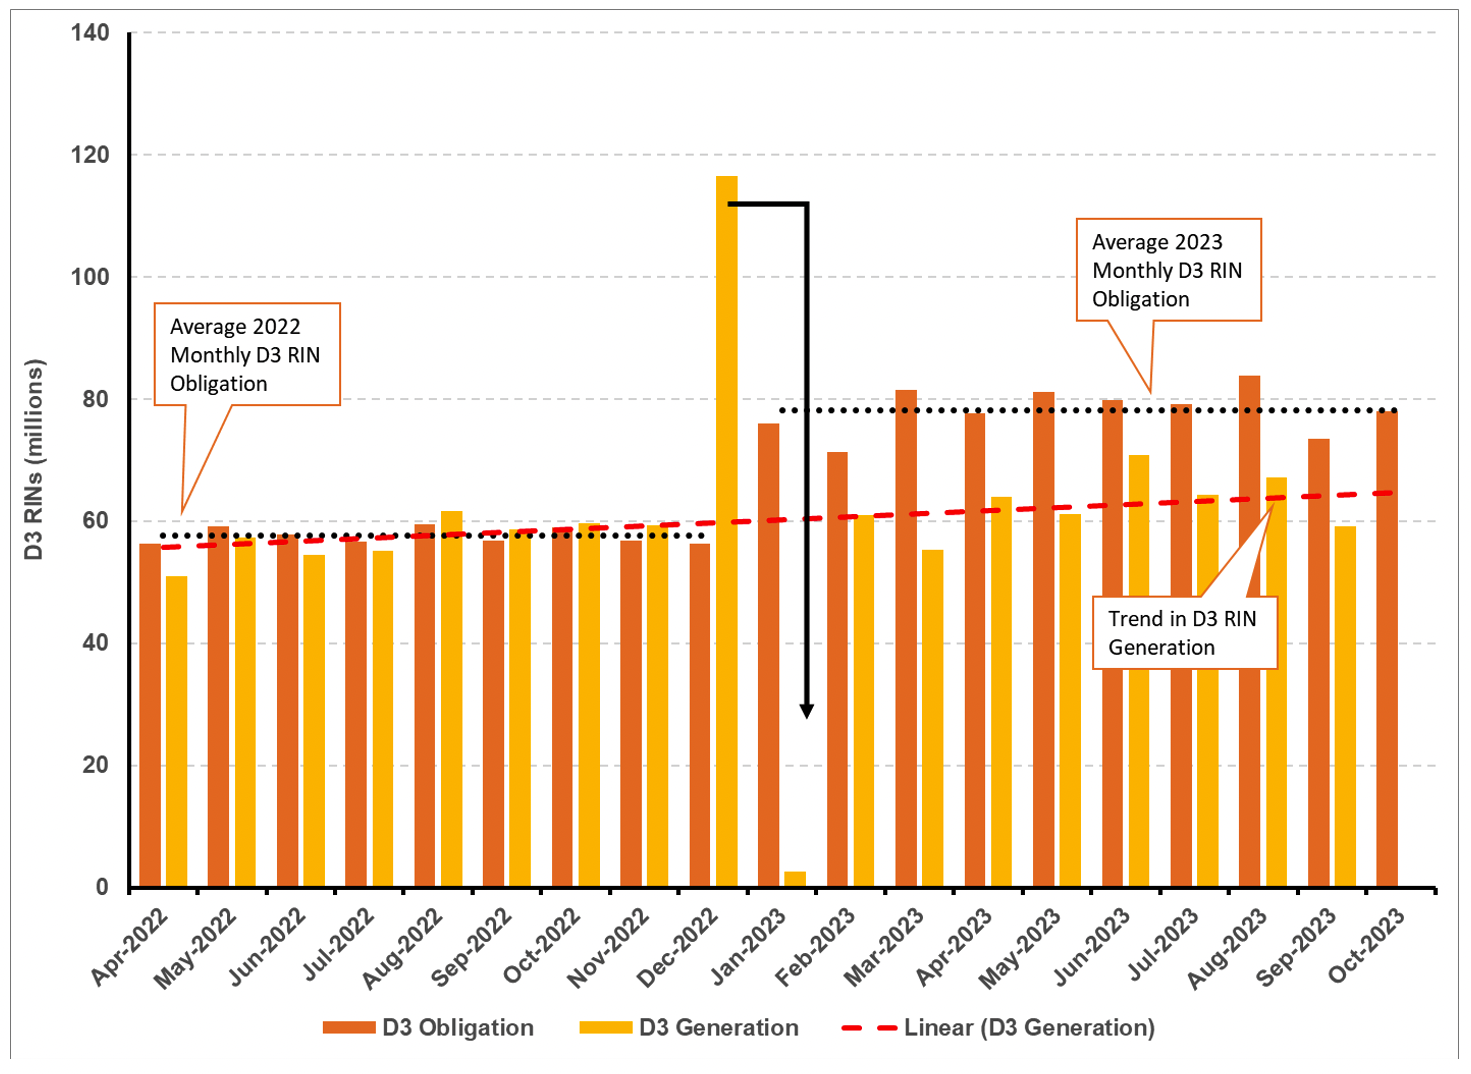
Source: EIA, EPA EMTS, Stillwater Analysis
If you are looking for further insights into the RFS, contact us here. We also produce an annual RINs outlook report providing a quantitative analysis of the market conditions that drive RINs prices including an overview of the RFS program, historical credit volumes and pricing, and a RINs price outlook through 2035. Unlike this article, which zoomed in on the short-term trends currently at play, our RINs Outlook offers a long-term view, assuming that supply and demand find their way to balance. You can learn more about Stillwater’s outlook offerings here.