Why did the retail fuel price spread between CA and WA collapse?
Link to article: https://stillwaterassociates.com/why-did-the-retail-fuel-price-spread-between-ca-and-wa-collapse/
July 20, 2023
Historically, California has had the highest gas prices in the country, mostly due to its unique gasoline specifications, isolated supply logistics that make it susceptible to unplanned refinery outages, high excise and sales taxes, and two climate change programs – the LCFS and Cap & Trade (C&T). California’s constant lead may be a thing of the past now, however, with the average retail gasoline prices in Washington state surpassing the average retail gasoline prices in California over the past few weeks. According to AAA, on July 10, the average price of regular gasoline in Washington was $4.964 per gallon while California averaged $4.873 per gallon. Both were far higher than the U.S. average of $3.543.
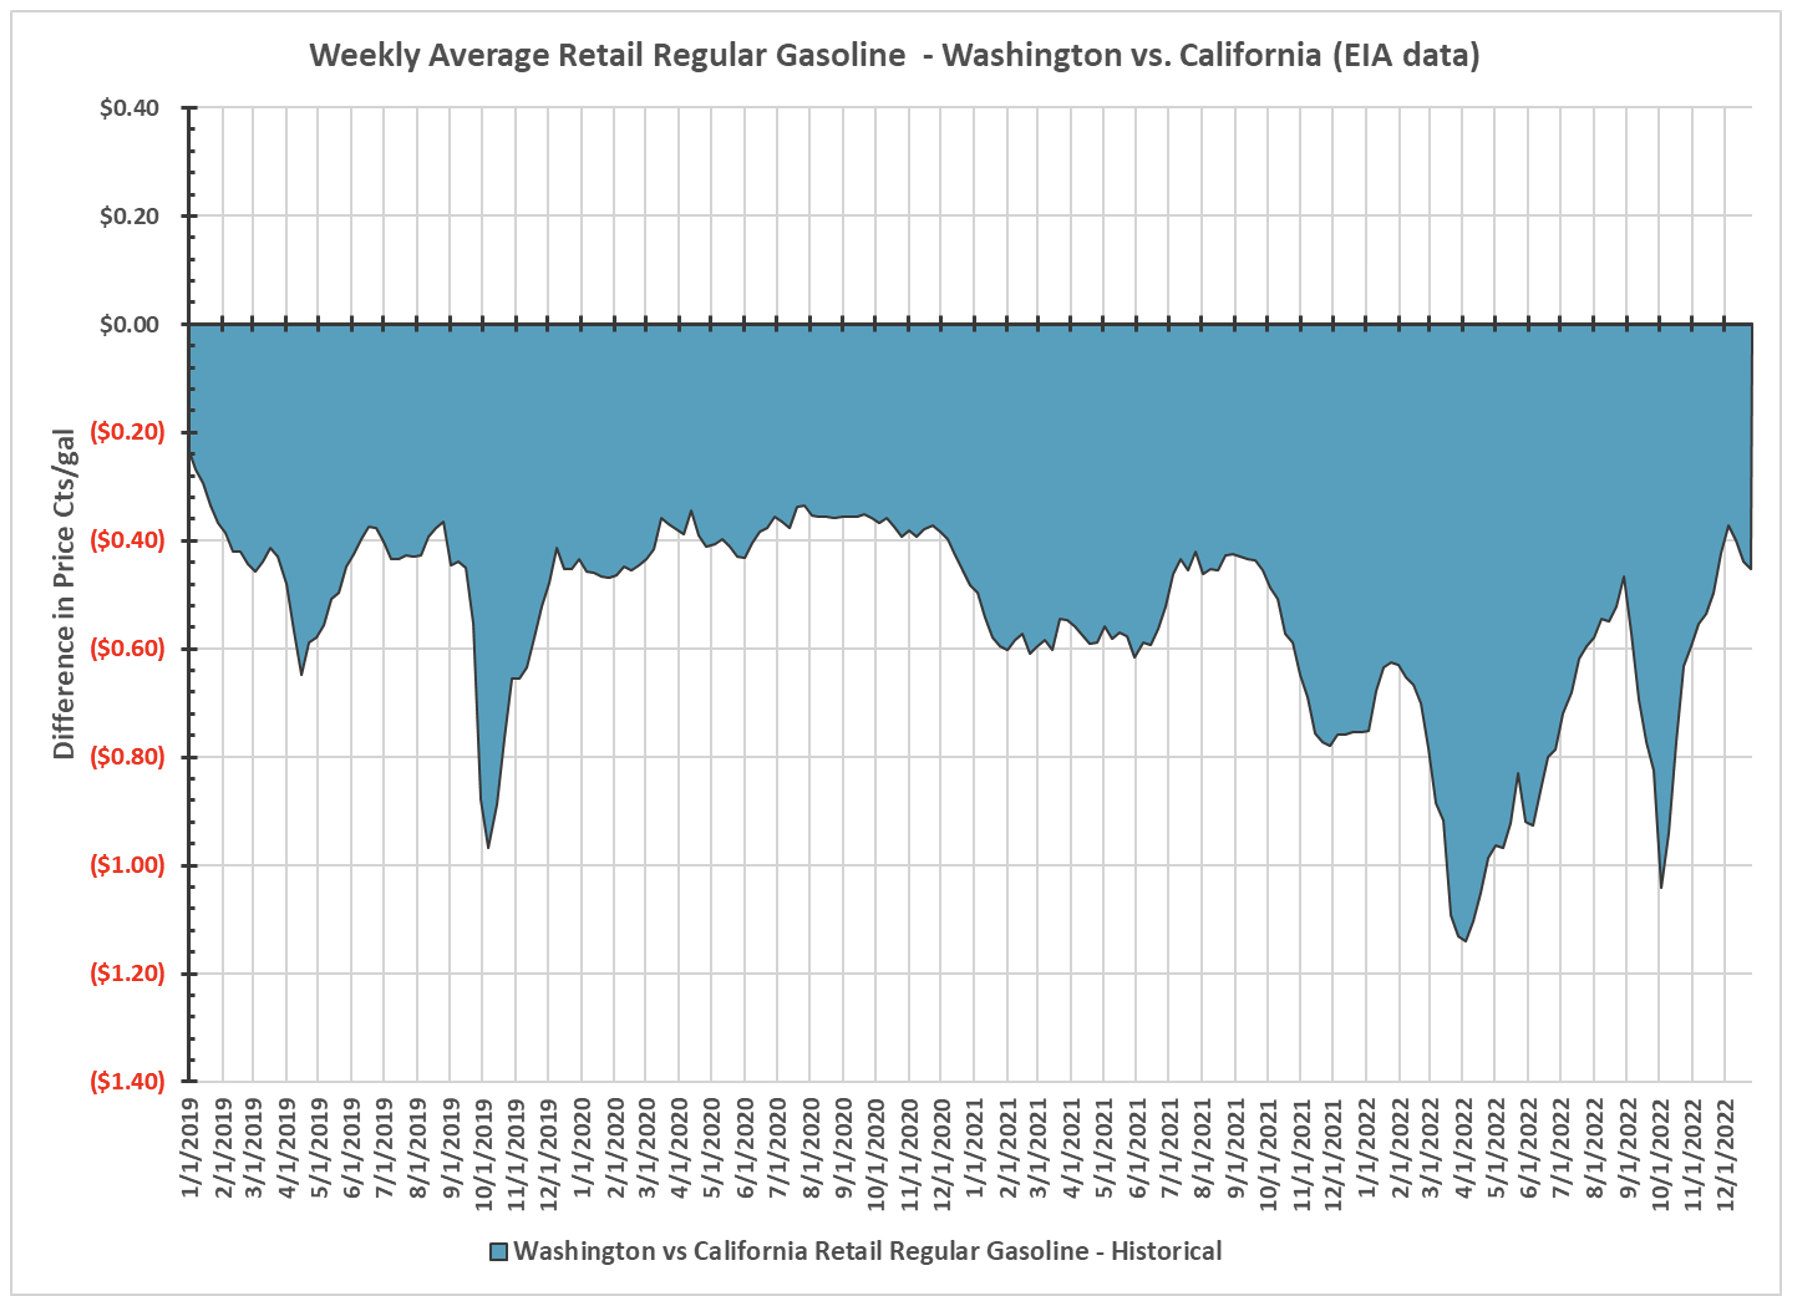
This is quite a switch for the historical relationship between these prices as Washington retail gasoline prices were $0.27 to $1.14 per gallon less than California from 2019 through 2022. This history is shown in the following figure through the end of 2022.
When 2023 is added, as shown in the next figure, the change in this relationship becomes evident. Through the first quarter of 2023, the difference between prices in the two states varied around 40-50 CPG which was not out of line with prior history. Starting at the end of the first quarter, however, the Washington average retail gasoline price began to ramp up relative to that of California, and by the summer Washington’s fuel prices had exceeded California’s.
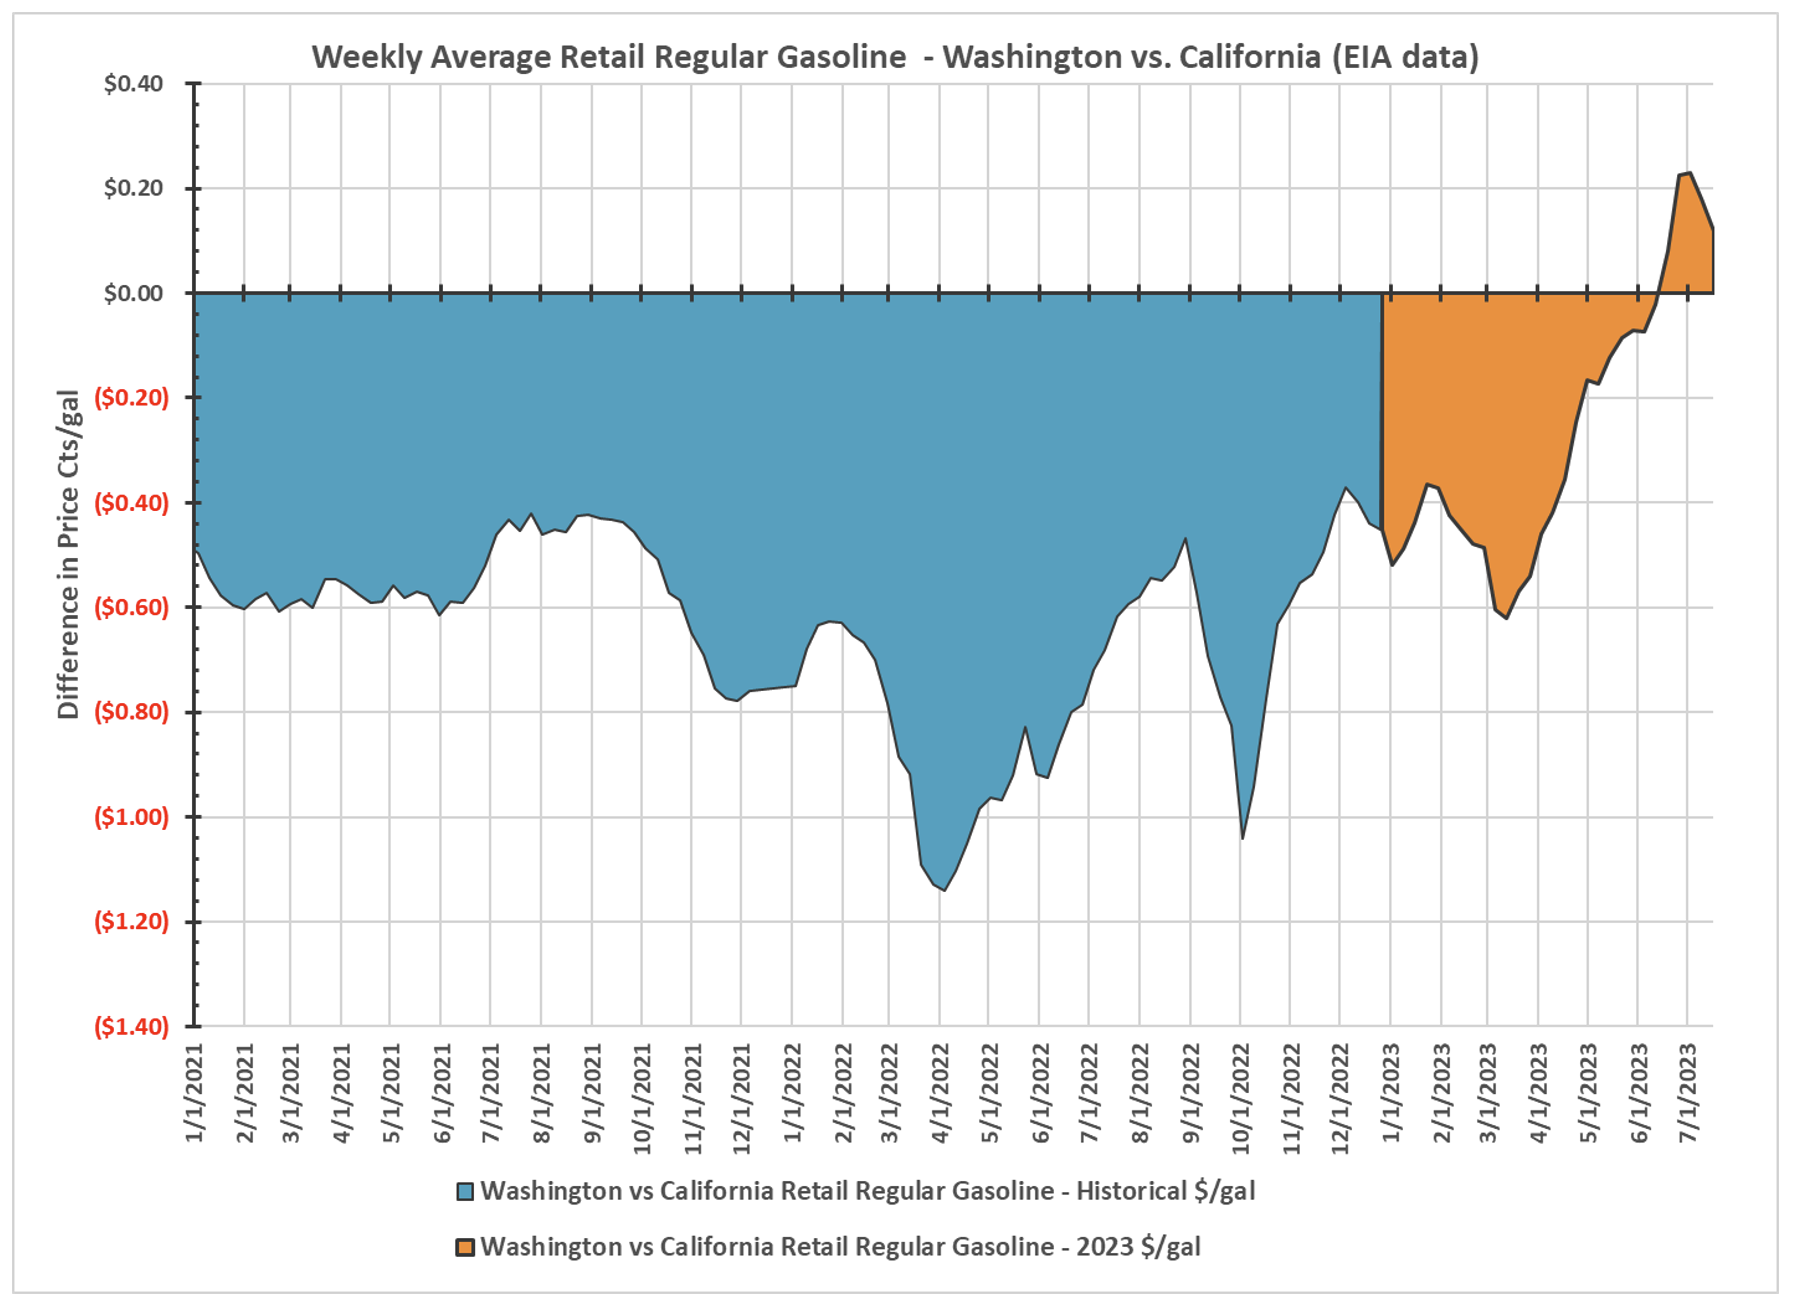
This is a dramatic shift, and some reports have attributed the change in the pricing relationship to refinery and pipeline outages. Although these events have undoubtedly contributed to the rise in prices, it should be noted that these events are not unique to 2023 as refinery and pipeline outages have also occurred historically.
What is the reason for this change?
Both Washington and California are on the West Coast, have access to the same crude oils, regularly supply gasoline to each other as well as Oregon, and have similar retail marketing structures. The differences, therefore, must be rooted primarily in specifications, taxes, and fees.
This situation begs several questions:
- How and why is Washington catching up with California?
- Why the lag between January CFS and C&I implementation and the June price spike?
- How does the stack of taxes and fees compare between WA and CA?
- Are the new high prices in Washington sustainable?
We answer all these questions and more in our recent LCFS Monthly Newsletter.
Stillwater sees things others miss. We have been tracking developments in California’s LCFS and C&T, Oregon’s CFP and CPP, and Washington’s CFS and C&I and the corresponding credit and fuels markets since each program’s inception. Our Associates leverage decades of experience in the transportation fuels industry to provide the insights offered in this article. We are also available to provide more in-depth and personalized analysis and outlooks for our consulting clients. If you find yourself wanting a deeper dive on the subjects we’ve covered in this article, contact us to learn how we can help.