Stillwater’s Projected Costs of the Approved HB 1091 Clean Fuels Standard
Link to article: https://stillwaterassociates.com/stillwaters-projected-costs-of-the-approved-hb-1091-clean-fuels-standard/
June 15, 2021
The Washington Clean Fuel Standard (CFS) has been signed into law, but the details of program implementation have not yet been developed by the state’s Department of Ecology (DOE). As such, its costs can currently only be estimated by comparing the Washington CFS legislation to the three existing LCFS-type programs in California, Oregon, and British Columbia (BC). Of these three, the BC program has the least publicly available information on the costs of credits sold, and the California program has the most. The following analysis compares the existing programs and reviews historical costs to assess the possible costs to be added by the CFS.
Comparison of Existing LCFS-Style Programs
Table 1 below lists the carbon intensity (CI) reduction schedules for the currently approved LCFS-style programs in North America. California and BC are expected to require 20% CI reduction by 2030, and Stillwater expects that Oregon will aspire to meet a similar schedule when that state’s Department of Environmental Quality (DEQ) evaluates the extension of its Clean Fuels Program (CFP). Canada is slated to implement its Clean Fuel Standard (Canada CFS) in 2022 and is scheduled to meet a 12.9% CI reduction by 2030 while Washington state’s CFS legislation (HB 1091) targets an 8.5% reduction that year. As a very rough estimate, the demand for low-carbon fuel increases proportionally to the CI reduction requirement, so demand in California and BC will roughly double from 2021 to 2030, and demand in Oregon should increase by roughly a factor of five over the same period.
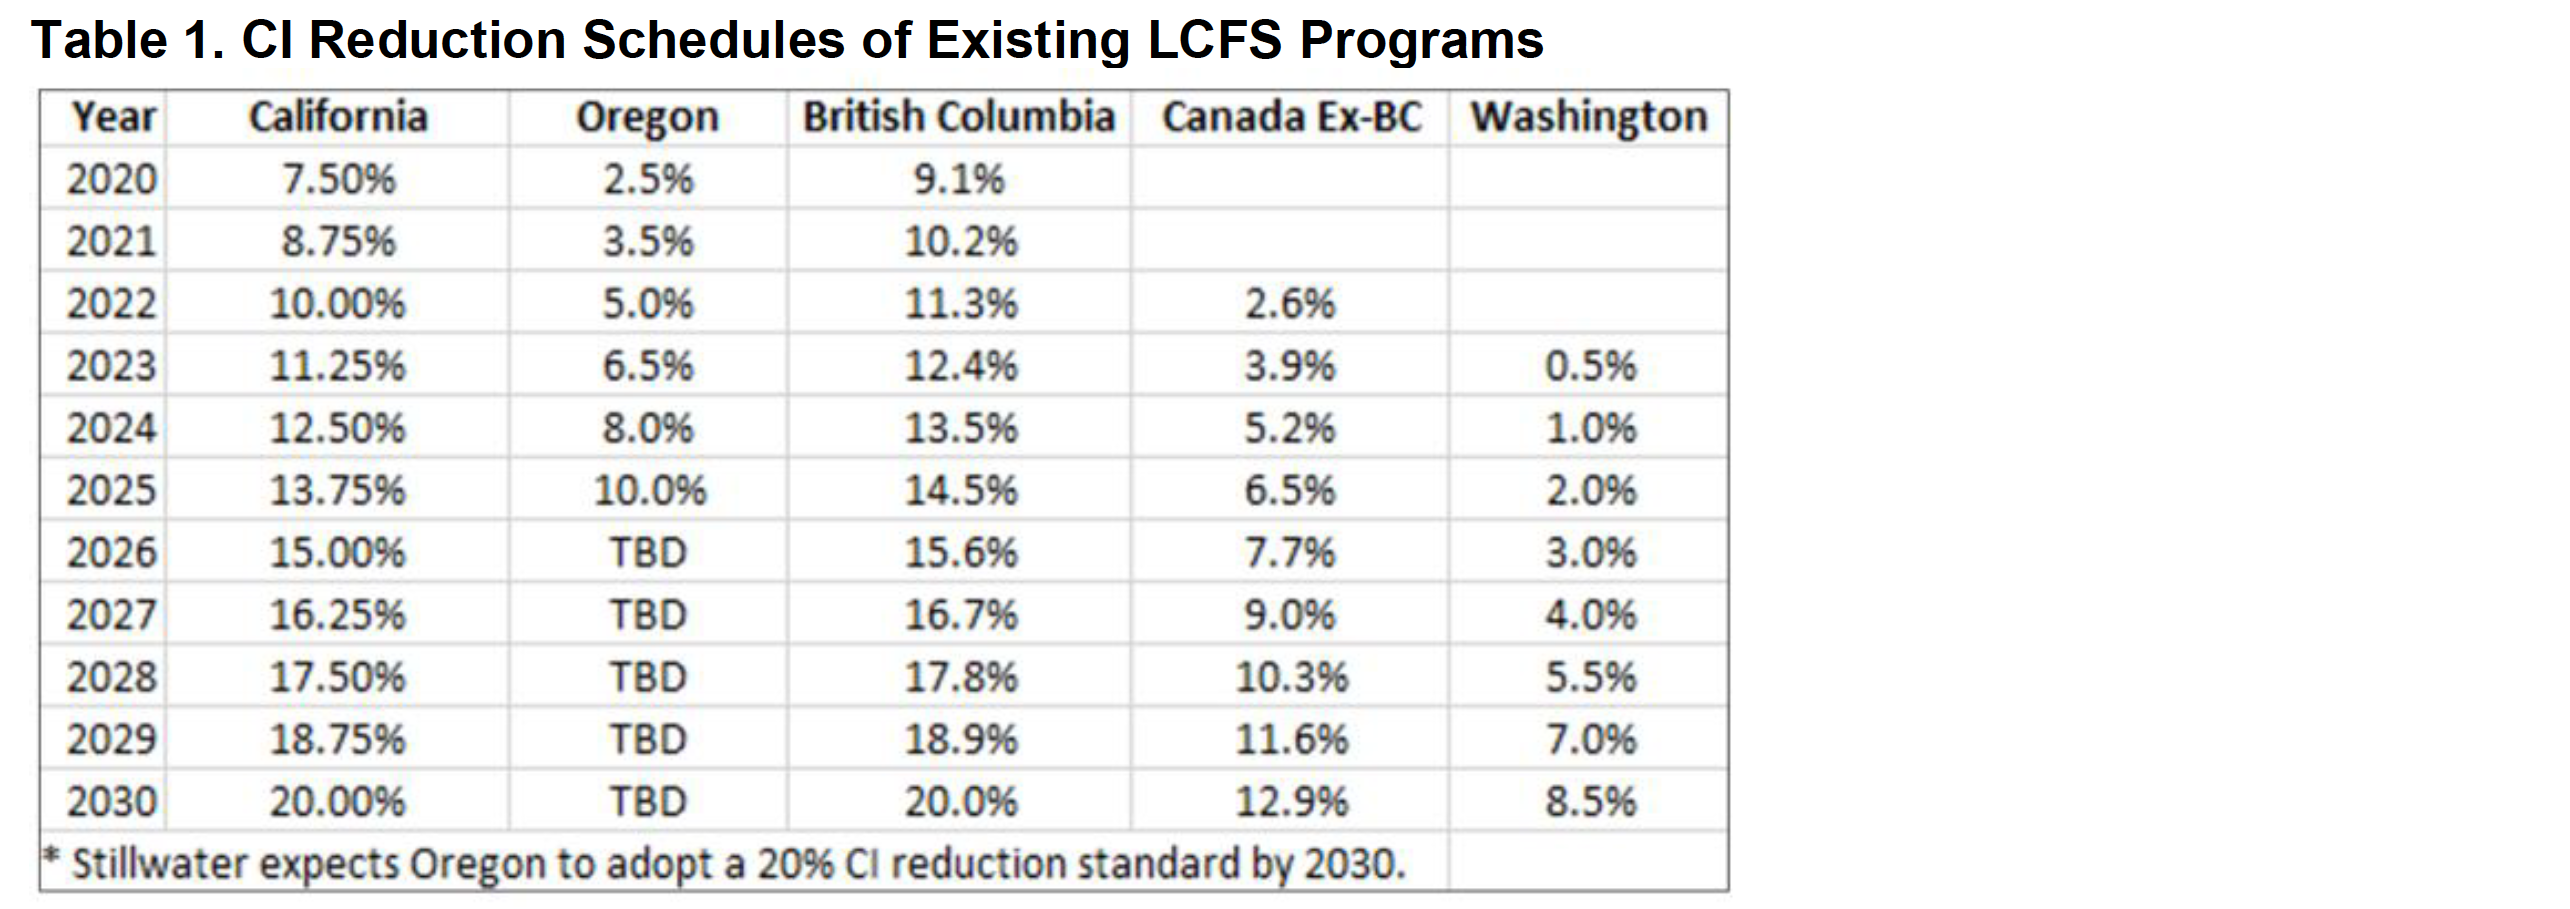 Sources: California Air Resources Board (CARB), Oregon Department of Environmental Quality (DEQ), British Columbia (BC) government website, Environment and Climate Change Canada
(ECCC), and the Washington State Legislature.
Table 2 lists the rates of fuel use governed by the existing programs and in other jurisdictions considering LCFS programs. A very rough proxy for low-carbon fuel demand is the % CI reduction listed in Table 1 multiplied by the size of the market as indicated by the product demand listed in Table 2. Washington, Oregon, and BC combined have less than half the market size of California, whereas the Canadian market is about the same size as California’s.
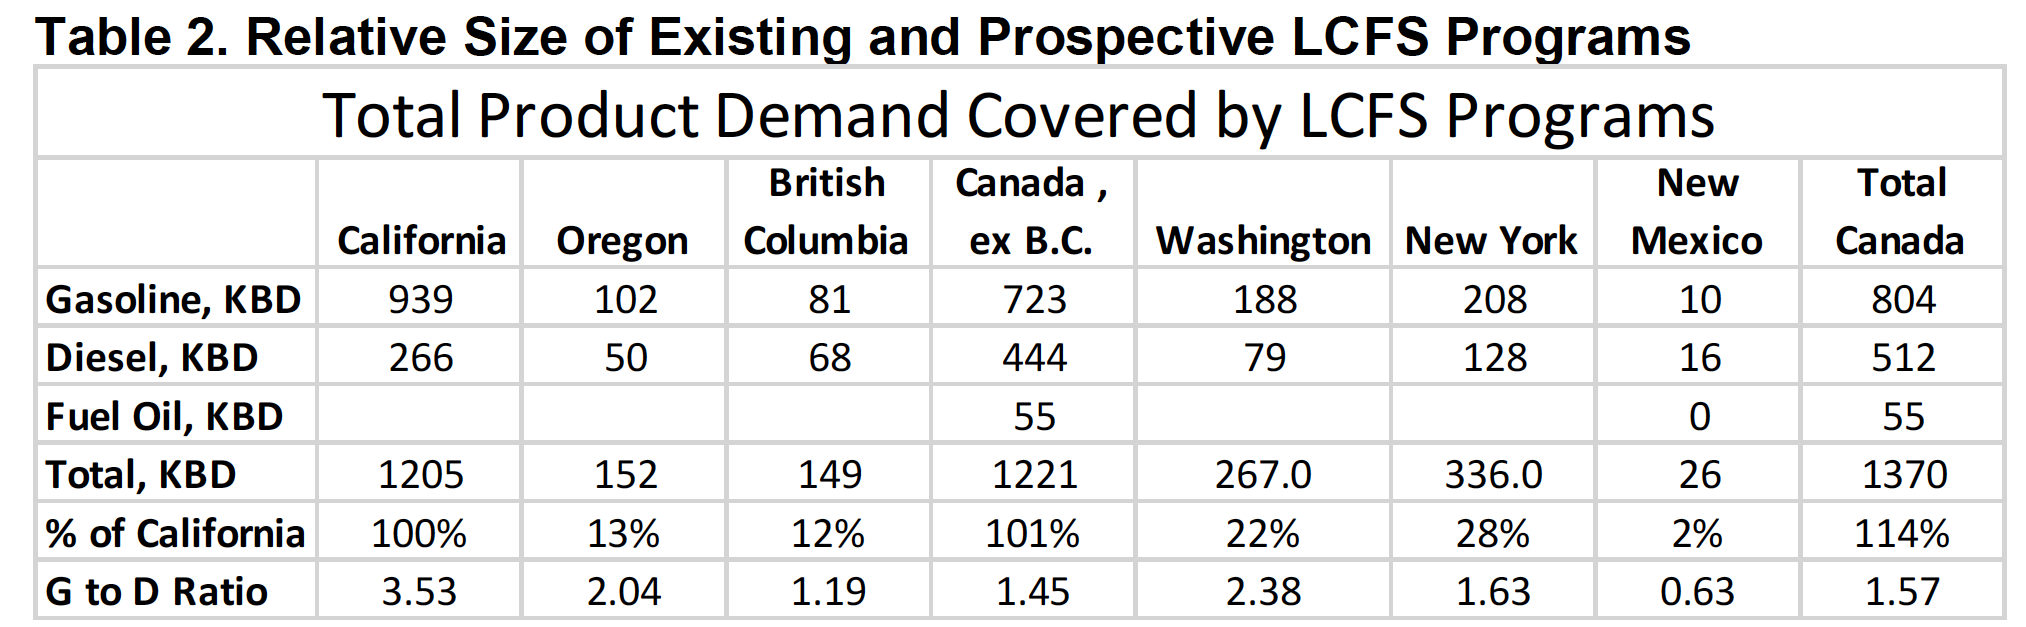 Demand estimates are approximate 2019 volumes taken from the following sources: California Energy Commission, CARB, Energy Information Administration (EIA), BC government website, Natural Resources Canada, and Stillwater analysis.
Cost of Compliance
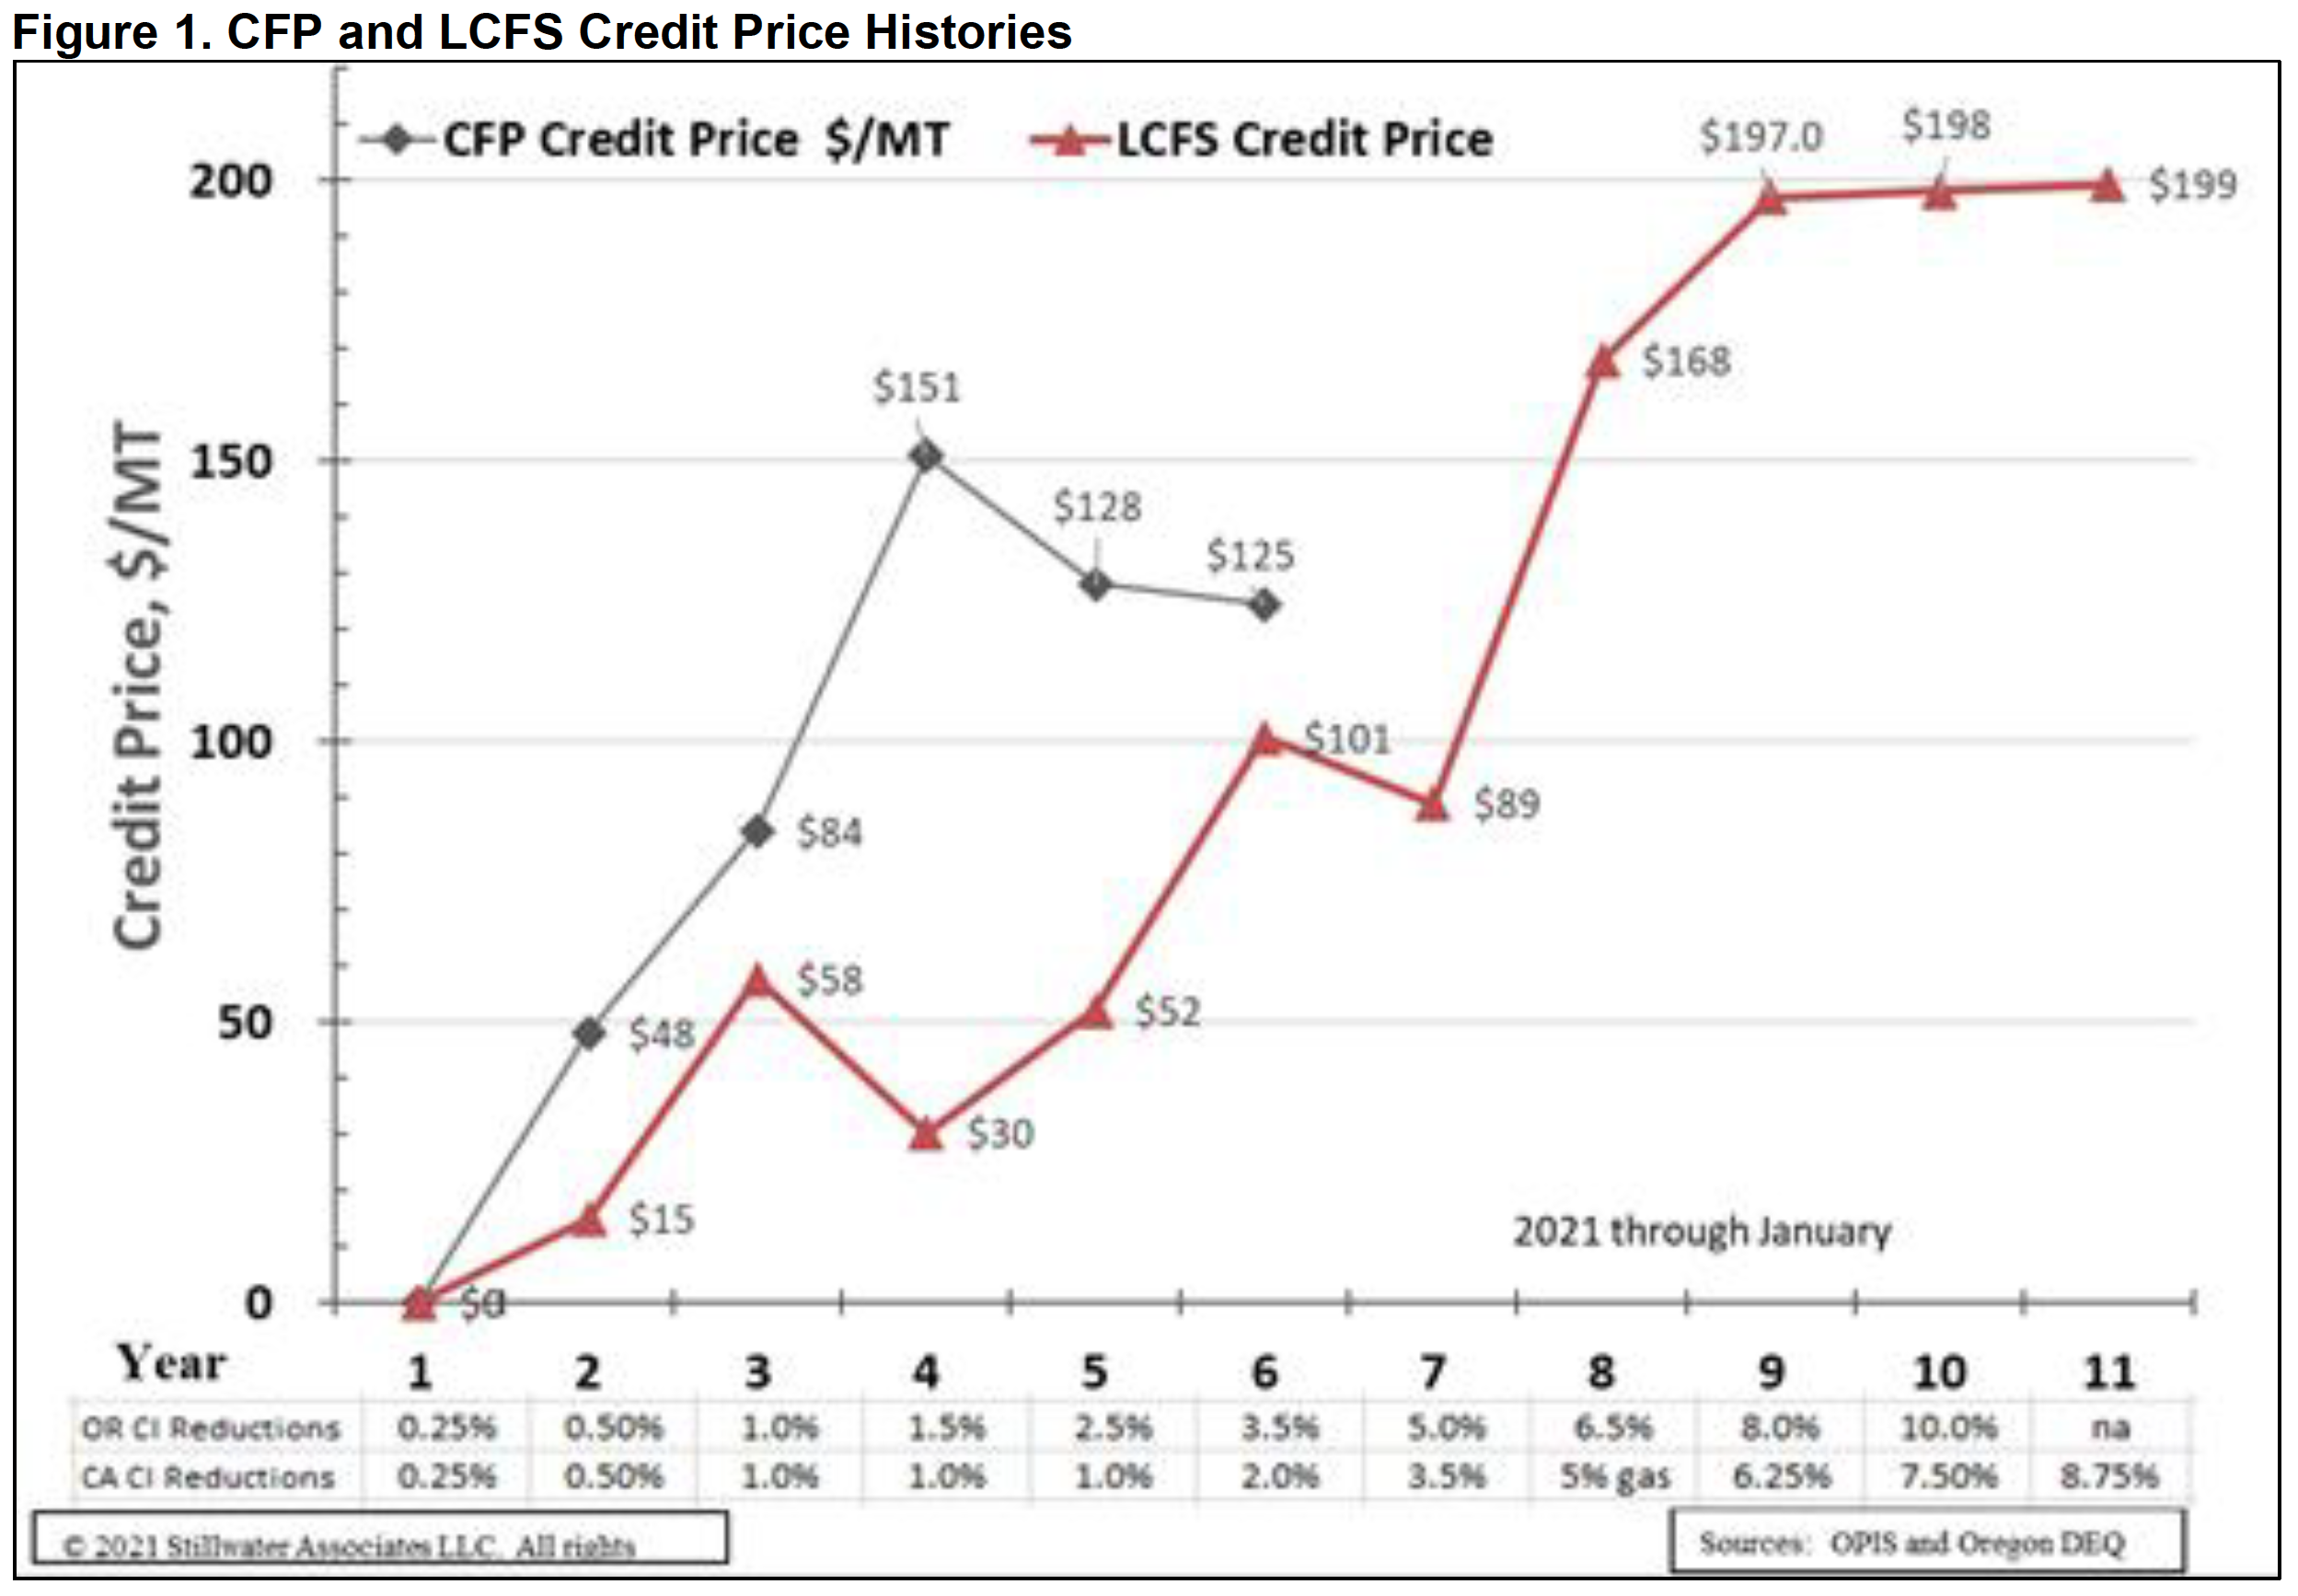
The costs to comply with LCFS programs are a function of the marginal cost to supply sufficient volumes of low-carbon fuels. If federal and other incentives are fixed, the value of LCFS credits must increase to create enough incentives to supply these fuels. The historical prices of credits sold in California and Oregon are shown below in Figure 1. Prices are higher in Oregon than in California for the level of CI reductions for several reasons. The CI reduction level was frozen at 1% for three years in California due to a lawsuit, which caused an excess of credits over that timeframe resulting in a significant “credit bank.” In addition, California’s LCFS began five years earlier than Oregon’s CFP, so California has always had a greater CI reduction requirement and has thus continued to attract most of the low-carbon fuels. While credit prices continue to be higher in California than Oregon, the competition for low-carbon biofuels has caused CFP credit prices to be higher than what they were in California at the same CI-reduction level.
Figures 2 and 3 below show the historical compliance costs for gasoline and diesel, respectively, over the lives of the California and Oregon programs. Because of the factors described above that account for the differences in credit prices between the programs, the costs to comply are higher in Oregon than they were in California at the same CI-reduction target. Because Washington is joining the competition for low-carbon fuels after California, Oregon, BC, and Canada, Stillwater expects the costs in Washington to be generally as high or higher than what they were for those programs.
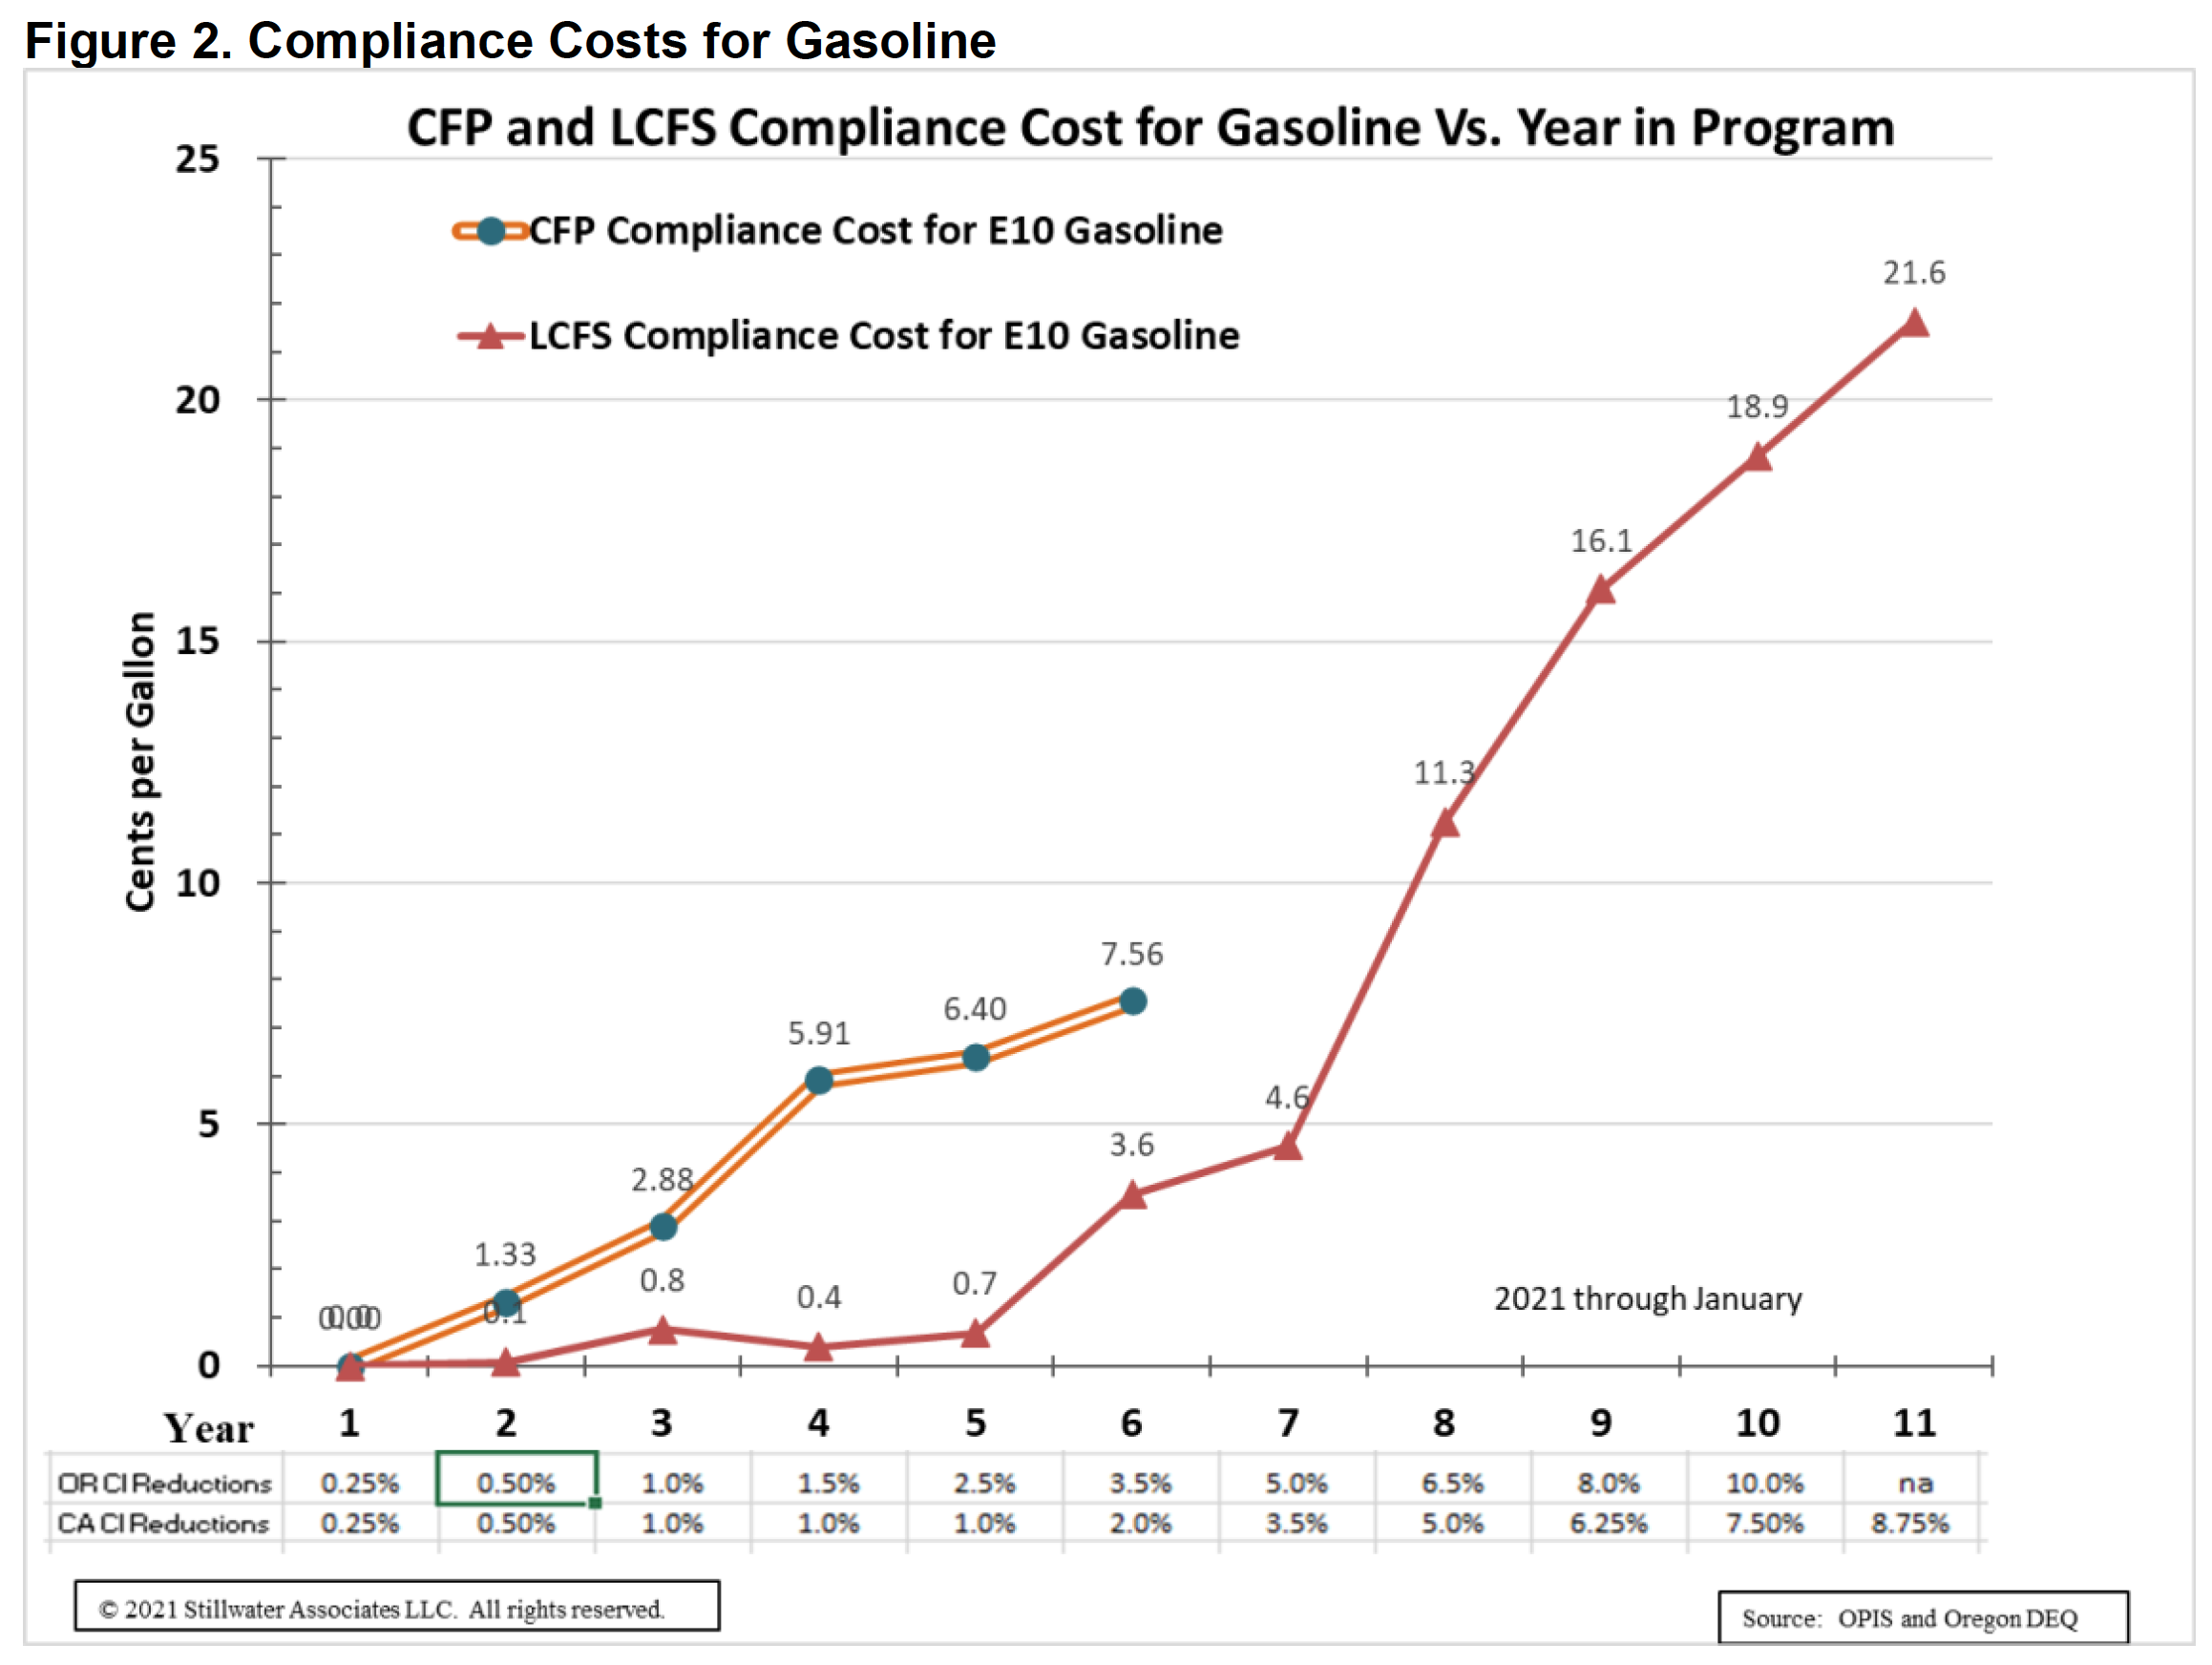
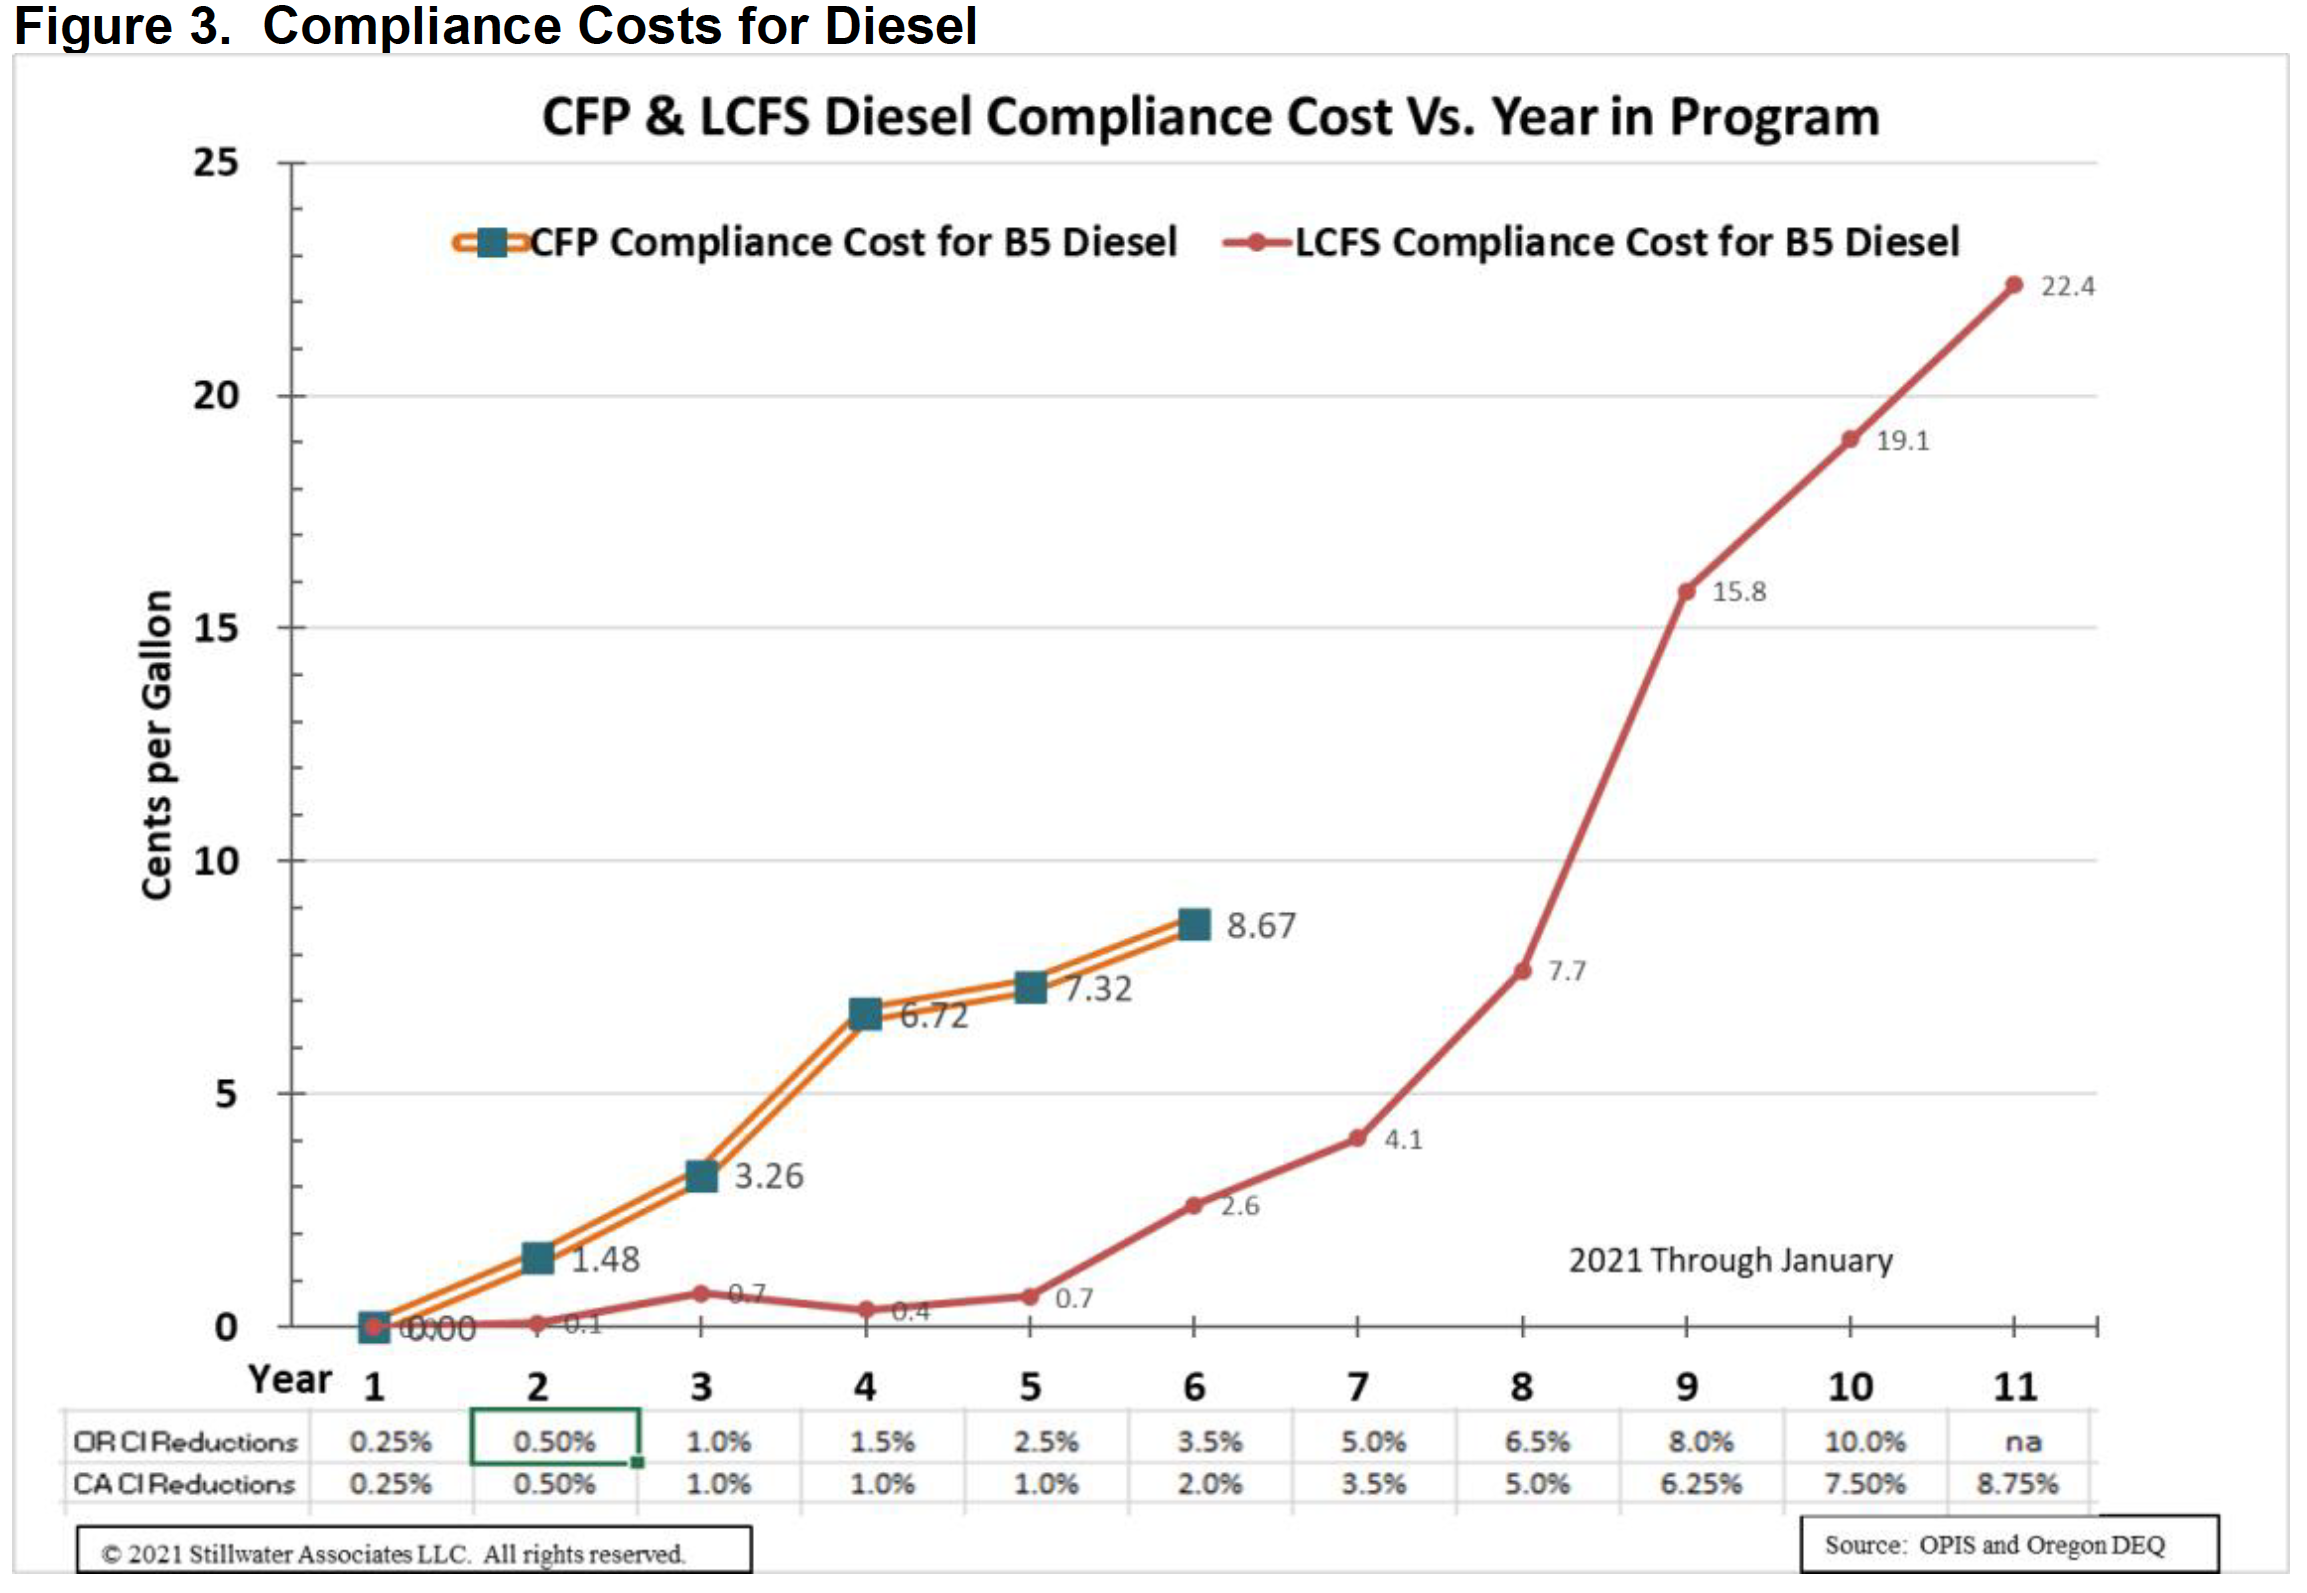
Figure 4 below shows the CFS CI reduction schedule if the state meets the requirements specified in the HB 1091 legislation. CI reduction will increase steadily from 2023 through 2031 before it freezes at 10% for 2031 through 2033 and then increases incrementally to 20% in 2038.
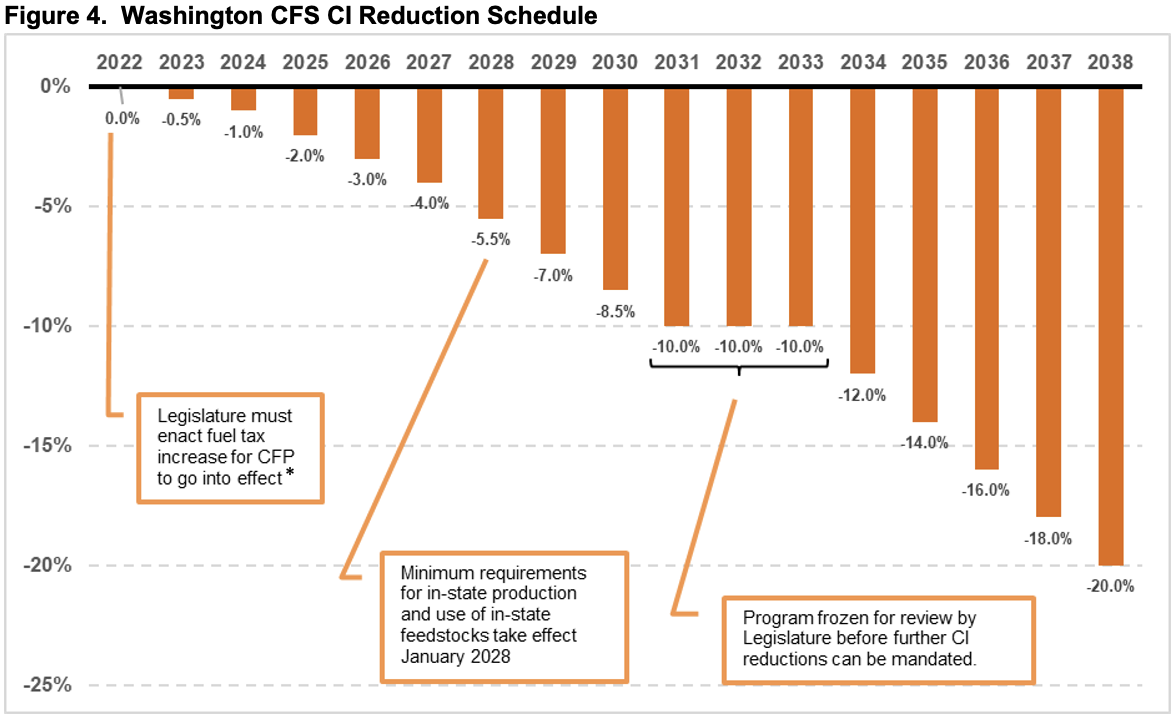
* Governor Jay Inslee signed HB 1091 into law on May 17, 2021, but he vetoed the portion of the bill that required
a new statewide transportation-funding package (including a fuel tax increase) for the legislation to take effect.
His amendatory veto is documented in https://www.governor.wa.gov/sites/default/files/HB%201091_PV.pdf
To estimate the cost of the Washington CFS program proposed in HB 1091, consider the following:
- California’s LCFS added about 22 cents per gallon (cpg) of costs to gasoline (CARBOB) and diesel (ULSD) in 2020 with a 7.5% CI reduction.[1] If LCFS credit prices remain constant, a 10% CI reduction for Washington’s CFS in 2031-2033 would add about 33% (the incremental increase from 7.5% to 10%) to the LCFS cost of gasoline and diesel in Washington, increasing this cost to 29 cpg. A Washington 20% CI reduction in 2038 would result in about twice the cost of a 10% CI reduction if credit prices remain the same, making the cost added to gasoline and diesel about 58 cpg.[2]
- According to the U.S. Energy Information Administration (EIA), total transportation fuels demand in Washington in 2018 was 123 million barrels (approximately 21% of California demand and more than double Oregon demand).[3]
Currently, petroleum products used in Washington state make up about 93% and 98% of the energy in the gasoline and diesel pools, respectively.[4] For California in 2020, petroleum products made up 88% of the transport pool to almost achieve a 7.5% CI reduction.[5] Renewable fuels made up 12% of the transport fuel. To meet a 10% CI reduction, renewable fuels will need to increase to about 16% (10/7.5 x 12%) of the transport fuel pool, which leaves 84% of the pool from petroleum products. Therefore, an estimate of the cost of HB 1091 in 2031-2033 with a 10% CI reduction with CFS credit prices held constant at California’s 2020 average credit price is:
84% x 123 million barrels x 42 gallons/barrel x $0.29 per gallon x 1 billion/1000 million = $1.3 billion per year
Using the same calculation and similar logic, the estimated cost of a 20% CI reduction standard in 2038 is estimated at:
68% x 123 million barrels x 42 gallons/barrel x $0.58 per gallon x 1 billion/1000 million = $ 2 billion per year
The above calculations are estimates, and actual costs added are likely to differ. Both of these estimates assume fuel mixes changing in ways similar to what has occurred in California, constant demand for transport fuels, and a constant LCFS credit price of about $200/MT. Credit prices could differ depending on supply and demand for low-carbon fuels, how demand for fuels could differ depending on changes in vehicle miles travelled and vehicle fuel efficiency changes, and how the CFS is implemented by the Washington State Department of Ecology. Whether the above costs are added, in whole or in part, to fuel prices will depend on the dynamics of the various fuels markets, including but not limited to fuel supply and demand.
[1] Average OPIS published LCFS credit price for 2020 and Stillwater analysis.
[2] The actual range of credit prices could be significantly more or less than this. However, prices have been near $200 for more than a year.
[3] https://www.eia.gov/state/seds/data.php?incfile=/state/seds/sep_use/tra/use_tra_WA.html&sid=WA
[4] Assuming 10% ethanol in the gasoline pool and 2% biodiesel in the diesel pool. References in the EIA Washington State Energy Profile.
[5] CARB LCFS Quarterly Data Spreadsheet, https://ww3.arb.ca.gov/fuels/lcfs/lrtqsummaries.htm and Stillwater Analysis