How Do ZEV Emissions Stack Up Against Super-Clean Gasoline and Diesel Engines?
Link to article: https://stillwaterassociates.com/how-do-zev-emissions-stack-up-against-super-clean-gasoline-and-diesel-engines/
August 21, 2019
by Gary Yowell
In 1990, California adopted the Zero Emission Vehicle (ZEV) Mandate designed to help achieve the state’s long-term emissions reduction goals by requiring manufacturers to sell specific quantities of battery-electric, fuel cell, and plug-in hybrid electric vehicles. The ZEV mandate has seen several modifications over the past three decades, and now there is a growing interest in expanding the program. In addition to the GHG-reductions of ZEVs, several state agencies cite the need for ZEVs based on their estimated particulate matter (PM) and nitrogen oxides (NOx) reductions relative to the average gasoline vehicle emissions. So, nearly thirty years after the ZEV program was established in California, how do ZEVs – mandated in part based on their air pollution benefits – compare against the cleanest gasoline and diesel light-duty cars and trucks on the road today? Our analysis shows that, given California’s ambient air quality and the available sources of electricity in the U.S., ZEV emissions levels do not necessarily outperform the cleanest available gasoline and diesel vehicles.
Particulate Matter (PM) Pollution
Since at least the 2013 model-year, nearly all diesel vehicle models, and several gasoline models have certified PM emission values below the estimated emissions for recharging ZEVs. This conclusion is reached by comparing the U.S. Environmental Protection Agency’s (EPA) new vehicle certification emission values with ZEVs recharged with GREET (Greenhouse gases, Regulated Emissions, and Energy use in Transportation) estimated electricity and a theoretical zero-emission, 100 percent solar/wind power. Figure 1 shows the laboratory-measured certification emission values for various vehicles and test cycles compared to GREET emission estimates. As can be seen, GREET overestimates diesel vehicle PM emissions while GREET’s gasoline emission rates range appears appropriate for a mean value analysis. Mean values, however, do not capture the other 50 percent of lower vehicle emission rates, which is an important omission when evaluating the environmental justification for the ZEV mandate. Note: This comparison is restricted to vehicle tailpipe emissions (labeled pump-to-wheel, or PTW) versus power grid emissions, ignoring 0.013 grams per mile (g/mi) PM estimated for all vehicles tire, brake, and road dust. We include the GREET well-to-wheel (WTW) emissions rate for gasoline for reference.
Figure 1. 2013 Vehicle Certification Particulate Matter Emission Value

Source: U.S. EPA Certification Emission Data for the 2013 model year & GREET 1_2018 Version, October 2018 release
It is possible that some of today’s gasoline and nearly all diesel vehicles have lower PM emissions than 100 percent renewably powered ZEVs. This is possible because the California Air Resources Board’s (CARB) and EPA’s 1970s era emission testing protocols have not kept up with today’s near-zero gasoline and diesel vehicle emission progress. Current regulatory laboratory test protocol excludes ambient air pollution from the tested vehicle. Laboratory tests are required to accurately measure a vehicle’s tailpipe emissions for regulation purposes. For environmental analysis, however, CARB and EPA assume a vehicle’s laboratory-measured tailpipe emission is the same as that of a vehicle operated on the road. Vehicles operated on the road, however, are exposed to varying ambient air pollution, frequently three-to-four times higher than air monitoring stations report. Correcting for on-road air pollution reveals several test cycles and vehicle models where tailpipe emissions are zero or negative, as displayed in Figure 2. Negative emissions represents a vehicle that is cleaning up the ambient PM pollution via air intake and scrubbing prior to exhaust. The gasoline and diesel air filter traps most of the PM, and the diesel soot filter cleans even more. ZEVs do not provide this critical benefit. In fact, ZEVs provide no PM benefit where the air PM pollution needs it the most (i.e., disadvantaged communities). In fact, the dirtier the ambient pollution the cleaner the super-clean gasoline and diesel net tailpipe emission are to the atmosphere. Conversely, a traditional ZEV operated in a dirty environment provides zero PM emission benefit.
Figure 2. Diesel Certification Emission Values with Estimated On-Road Ambient Air Pollution Impacts
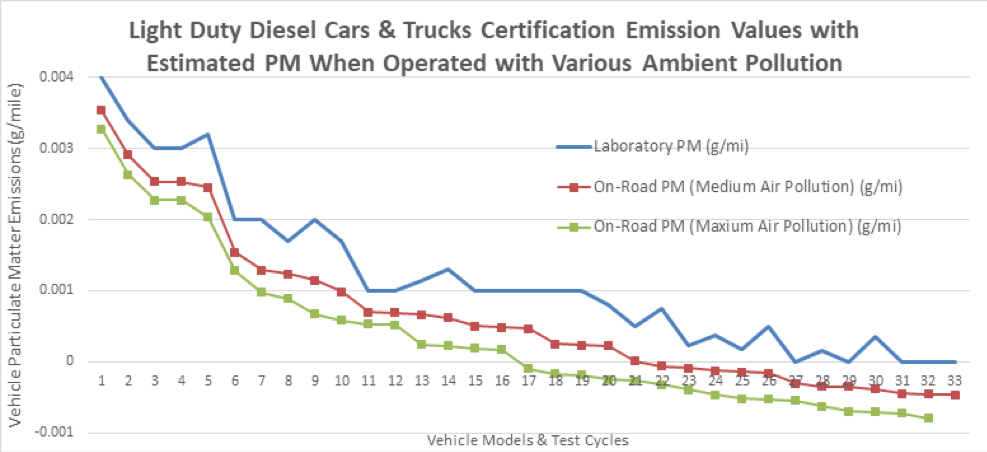
Source: U.S. EPA 2013 Certification Emissions adjusted by Stillwater Associates to account for ambient air pollution measured by the Health Effects Institute
NOx Emissions
CARB’s 2015 emission inventory suggests that light-duty vehicles – the vehicle class to which the ZEV mandate applies – represent 5.5 percent of statewide NOx emissions. Reviewing the cleanest 25 percent of all 2013 model-year certification data shows that these vehicles still contribute to NOx air pollution, albeit 99 percent lower than 1970 levels. EPA’s fuel economy guide states that light-duty automobiles operate 57 percent of the time on the highway for fuel economy calculations. In fact, a large fraction of vehicles tested on the highway cycle was estimated to be negative NOx emitters with the inclusion of ambient on-road NOx pollution. This is an important consideration given that highway operation is a significant NOx emission source from mobile applications and direct human exposure to this pollutant. However, by ignoring the fact that internal combustion engines consume air (along with its NOx pollution) leads CARB and EPA to not observe that the cleanest gasoline vehicle models’ NOx emissions can be negative for NOx pollutants up to 57 percent of the time.
Figure 3 U.S. EPA Certification (Laboratory) NOx Emission Values vs On-Road NOx Estimated Emissions (cleanest 10%)

Source: U.S. EPA 2013 Certification Emissions adjusted by Stillwater Associates to account for ambient air pollution measured by the Health Effects Institute
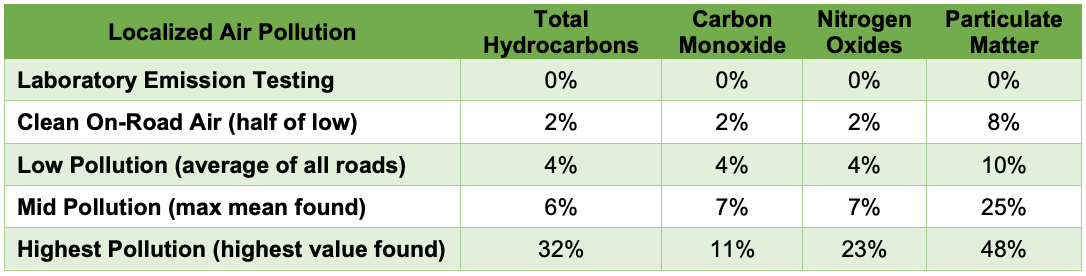
Only locations in violation of health-based ambient air quality standards pose health risks. As such, it is important to focus on air pollutants and locations with air quality in violation of health-based standards when discussing the health effects of criteria pollutants from vehicles. Interestingly, the locations with poor air quality days are where the cleanest internal combustion vehicles would provide the greatest health benefits by scrubbing the ambient air taken into the engine. Table 1 illustrates the percentage of models and test cycles with less than zero net emissions out of the total 2013 model-year emission values population. We have adjusted these values to account for various air pollution levels measured in Los Angeles by the Health Effects Institute. Days and locations in excess of air quality standards are characterized as mid and high localized air pollution. As can be seen, nearly half of the 240 vehicle models and test cycles tested for PM emissions have negative PM emissions under the highest ambient air pollution conditions.
Table 1. Portion of 2013 Model-Year Test Cycles and Vehicle Models with Negative Net Emissions in Varying Ambient Air Pollution Conditions
CO2 Emissions
Figure 4 compares 2013 model-year vehicles’ CO2 emissions restricted to the lowest emitters. As can be seen, electric vehicles (EVs) charged with electricity assumed at the GREET-estimated U.S. grid average power carbon intensity, have CO2 emissions slightly lower than the cleanest 10 percent of gasoline vehicles and slightly higher than renewable-diesel fueled vehicles. Petroleum diesel shows similar CO2 emissions as EVs recharged with Coal Boiler Combined Heat and Power (CHP). Presently, electric and renewable diesel CO2 emissions are lowest but vary significantly across the vehicle pool due to the wide range of options for refill/recharge.
Figure 4. Vehicle Fuel Economy Adjusted to CO2 Emissions vs Electric Vehicles (gasoline cleanest 10%)
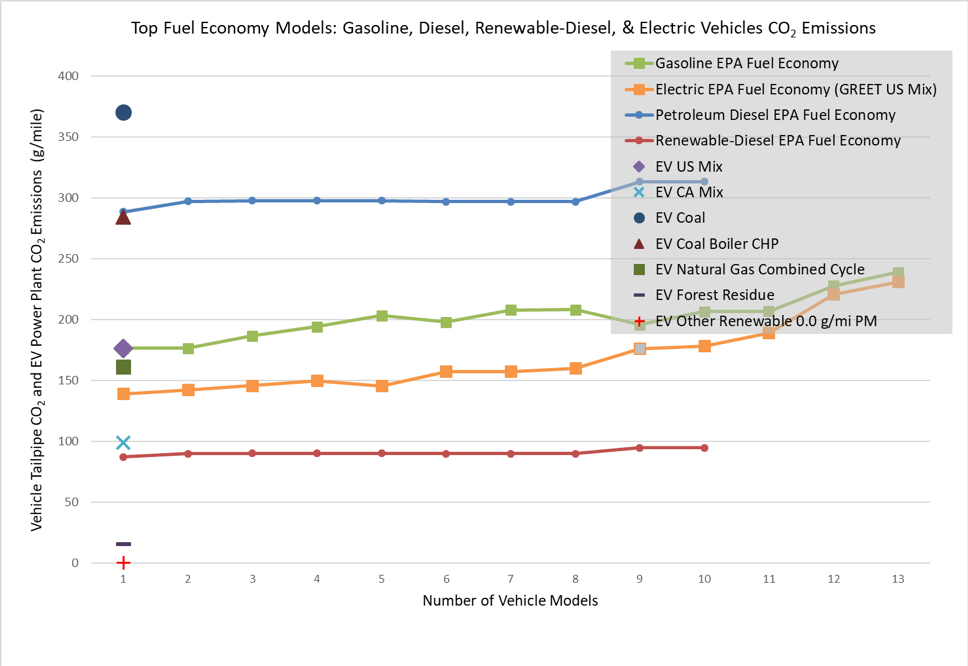
Source: U.S. EPA 2013 Certification Emissions and GREET1 1.8 version, October 2018 release
Conclusion
When regulators use weighted-averaging emission rates for gasoline and diesel vehicles, they miss the fact that a small but growing population of gasoline and diesel models are providing zero- and even negative-emission operation (on a criteria pollutant basis) in the most critical air quality regions on days and locations exceeding ambient air quality standards. Furthermore, CO2 emissions from renewable-diesel-fueled vehicles and ZEVs are similar assuming ZEVs recharged with GREET California power plant mix estimates. Depending on their recharge source, ZEVs can emit up to twice as much CO2 as the cleanest, high-fuel-economy gasoline vehicles.
Today in California, ZEVs make up roughly 500,000 vehicles and grow by 150,000 annually. State mandates and executive orders seek to increase ZEV penetration to five million by 2030. We can already see similar super-clean gasoline and diesel populations, which may be operating with effectively zero-to-negative criteria pollutant emissions during ambient air violation days. It is probable that there are more gasoline and diesel vehicles operating today and more tomorrow that will be as clean or cleaner than the mandated ZEV percentages, especially on air-violation days. If CARB and EPA recognized this feature and gave credits to manufacturers, this population of super-clean internal combustion engines could grow even faster.
Further study is required to assess the potential environmental benefits of the super-clean gasoline and diesel vehicle populations. Unlike ZEVs, of course, the internal combustion engine is not a zero emitter for all miles traveled and in all conditions. Furthermore, ZEVs are not required to maintain clean air and meet ambient air quality standards. Ambient air violation days – the days on which super-clean gasoline and diesel engines truly shine in this analysis – typically occur 5 and 20 percent of the year (for PM & ozone respectively) for Los Angeles, and less for various locations historically. Consequently, in Los Angeles, ZEVs provide zero-emission operation 100 percent of the time, of which 80-95 percent the time they provide no health benefits since they are operated when and where the air quality is below health-based standard thresholds. That is to say, when a ZEV is operated in areas exceeding ambient air quality standards, it provides no harm (since it’s not emitting pollution), but it also provides no air-quality benefit, because it does not clean ambient pollution like super-clean gasoline or diesel vehicles. Conversely, super-clean gasoline and diesel vehicles, with certified emission values 98-99 percent lower than 1970 levels, may contribute to pollution 80-95 percent of the time – when air quality days are within the health-based standards threshold – but this pollution could be considered non-harmful as it is below the health-based standards threshold. During air violation days, however, super-clean gasoline and diesel vehicles provide greater air-quality benefits than traditional ZEVs, due to their variable but substantial net-zero and net-negative criteria pollutant operations. Further study would help clarify this new paradigm.
Want to receive insights like this straight to your e-mail inbox each month? Sign up for our complimentary Stillwater Monthly Newsletter.
Categories: News, Policy, Technology Development, White Papers