Where Will All of the Renewable Diesel Go?
Link to article: https://stillwaterassociates.com/where-will-all-of-the-renewable-diesel-go/
August 1, 2021
By Jim Mladenik, Olivier Macé, and Kendra Seymour
The many announcements in the past months of projects to modify refinery and existing facilities to produce renewable diesel (RD) has caused many observers to ask two questions:
- Where will all the feedstocks come from?
- Where will all the RD go?
The first of these questions is addressed in a series of monthly highlights in Stillwater’s LCFS Newsletter. In this article, we will address the question of where all the RD will go.
North American RD Supply
The U.S. Energy Information Administration (EIA) published a recent analysis, based on public announcements, that shows North American RD production capacity increasing from 38 thousand barrels per day (KBD) at the end of 2020 to between 210 and 330 KBD in 2024 as shown in the figure below. (Note: The upper end of this range is greater than all diesel consumption in California and is about 5% of total U.S. diesel production capacity.)
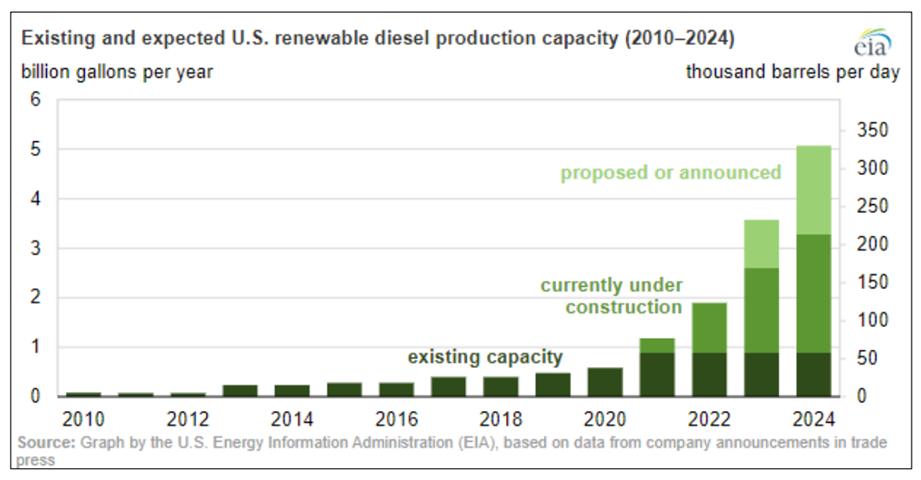
In addition to the increased U.S. capacity, Neste is in the process of expanding its Singapore production facility from 20 KBD to 43 KBD by in 2023. Most of the production from this facility has been sold into the West Coast markets of North America (California, Oregon and British Columbia) even though Neste has been working with stakeholders in the Pacific Basin to develop new markets. For example, in June of this year, Neste and ITOCHU jointly announced the first delivery of RD into Japan. If the Neste’s capacity is added to that in North America, the total range of RD capacity available is 260 to 370 KBD. Assuming a 90% utilization rate is reasonable over the long term, this capacity is enough to supply about 330 KBD of product.
North America RD Demand
Transportation fuel demand was much lower in 2020 and into 2021 due to the pandemic and only recently returned to 2019 levels. During 2020, RD consumption in California was about 38.4 KBD, and total Low Carbon Fuel Standard (LCFS) credits generated in California fell just short of deficits.[1] However, due to the demand destruction, demand for petroleum products (gasoline and diesel) declined by 16%.
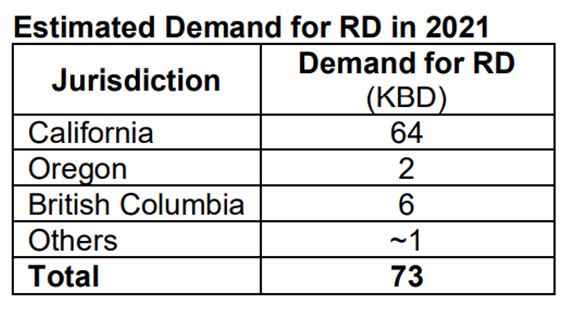
In the first quarter of 2021, the carbon intensity (CI) reduction requirement under the LCFS increased from 7.5% to 8.75%. For the same period, demand for petroleum products was still 15% below 2019 levels, LCFS deficits exceeded credits by 6%, and RD blending equaled about 52 KBD, which is almost 23% of the diesel pool. Assuming demand recovers and RD use (and the associated LCFS credits) increases to balance deficits, the total demand for RD in California is about 64 KBD in 2021.
The remaining North American demand for RD is mostly in Oregon and British Columbia (BC) due to the incentives provided by the Oregon Clean Fuels Program (CFP) and the BC-LCFS. Doing similar analyses for Oregon and BC, we estimate the demand for RD required to balance deficits with credits are about 2 and 6 KBD, respectively.
Outside of these three jurisdictions, there are some local transit authorities also known to purchase RD even without the LCFS credits to offset the price premium compared to fossil diesel. The approximate 2021 demand for North American RD is displayed in the table below.
Over the next four years, the LCFS programs in Washington state and Canada will be implemented. The CI reduction schedules for all existing and forthcoming programs are shown in the table below.
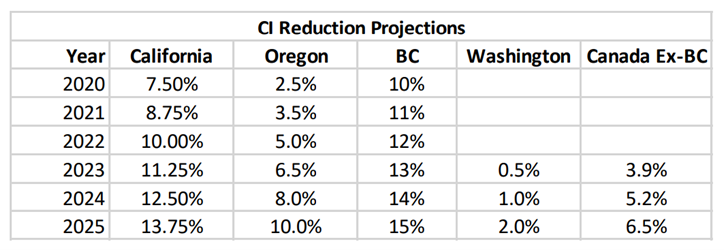
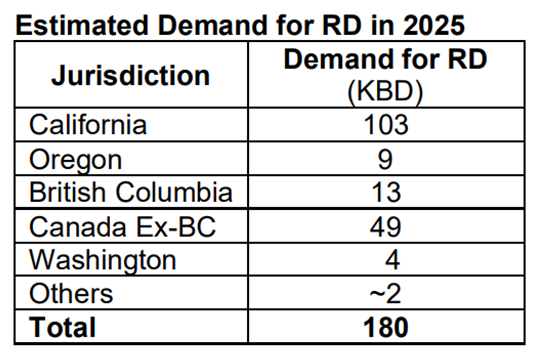
Note the comparatively more stringent CI reduction required in Canada from the beginning of the program. When taking into consideration the fact that the Canadian fuels market (outside of BC) is about the same size as California, while the other markets are much smaller, it is clear that Canada will be the second largest source of demand for low-carbon fuels from its inception. When considering these standards (as well as the likely increases in credits generated for these programs from all sources) and considering the demand demonstrated in California relative to the size of its pool of transport fuels, Stillwater estimates the total volume of RD needed to meet these programs increases to nearly 180 KBD by 2025. If other programs are adopted and/or regulators adjust the CI reduction requirements to account for the additional supply of low-carbon fuels, the demand could be significantly greater. Even so, the supply anticipated from all the projects announced to-date is significantly higher than this estimated demand. Stillwater’s rough estimates for 2025 RD demand in North America by jurisdiction are listed in the table below.
As mentioned above in the discussion of current North American demand, in the first quarter of 2021, demand for RD in California was about 52 KBD. If demand in the rest of the U.S. was about 3 KBD as Stillwater estimates, total U.S. demand in 1Q2021 was about 55 KBD. Data in the EPA Moderated Transaction System (EMTS) show 38 KBD of domestic production, 26 KBD of imports and 5 KBD of RD from co-processing for a total supply of about 69 KBD. These data indicate that about 14 KBD of RD is being exported from the U.S. Most of this is probably being shipped to Europe from U.S. Gulf Coast production facilities such as those owned by REG and Diamond Green, which begs the question “Can increased exports of RD from North America balance the future demand for RD with projected supply?” To assess this question, we turn to the market for RD in Europe for some insights.
Incentives for RD in Europe
In Europe, the share of renewable fuels – including RD – in the transportation fuels pool is being driven primarily by the EU-level mandate defined in the second Renewable Energy Directive (REDII). (Countries outside the EU, such as the UK and Norway, are also committed to keeping pace with the trajectory set by the EU.) The first RED expired in 2020 and had demanded a renewable share of 10% by energy content; REDII extends to 2030 and is on a path to increase this level modestly to 14% by 2030. Recent proposals from the European Commission as part of the “Fit for 55” package (aiming for 55% greenhouse gas (GHG) emission reductions by 2030) are much more ambitious and would raise the bar in 2030 to possibly 26% (by energy content) or may move the mandate to a GHG basis similar to LCFS, with 13% CI reduction by 2030. The European Commission also has proposals for renewable mandates in the aviation and marine sectors. In a similar vein, the UK has recently upped its 2030 target to 14.6%vol (from 9.6% today) and is considering its own aviation mandate.
All this is, of course, bullish for RD. Several European countries (Germany, France, the Netherlands, and Scandinavian countries among others) have already exceeded the B7 blendwall (7 vol% biodiesel blend in diesel) and require drop-in fuels such as RD to comply with their national obligations. Others, like the UK, would be in a similar position were it not for the ability to double-count biodiesel from waste. What do we mean by “double-counting”? For example, a B7 blend using waste fatty acid methyl esters (FAME) made from used cooking oil (UCO) is deemed equivalent to B14 due to UCOME (FAME from UCO) being rewarded with twice the amount of credits – by volume or energy content – that would be awarded to crop-based (rapeseed oil or soybean oil) biodiesel. These double-counting provisions are facing criticism and could disappear in the next version of the RED, improving prospects further for RD.
On the bearish side, the potential for electric vehicles (EVs) to capture an increasing proportion of the renewable transport mandates is the main concern for RD producers. EVs (and hydrogen) are favored and supported over the likes of RD by regulators across Europe. Should their rate of adoption exceed the trajectory of the overall transport obligation, these alternative fuels would start to eat into the demand for liquid biofuels (like RD). Other bearish factors include the overall decline in demand for road transportation fuels – from demand management and vehicle efficiency – and potential relaxations of the blendwall (increasing allowable biodiesel blends from B7 to B10 or ethanol blends from E10 to E15).
Still, the bullish sentiment prevails among the “biofuelitterati,” and expectations are that demand for RD in Europe will grow rapidly from pre-pandemic levels of approximately 100 KBD (including co-processing). In a scenario where the renewable share of road transport energy rises by 16% in the next decade – from 10% to 26% – and where RD accounts for a third of that growth (the rest coming from non-liquid fuels and blendwall relaxation), it would not seem unreasonable to expect a doubling or perhaps even a tripling of current demand for RD in Europe. This bullish outlook assumes, of course, that either a) allowable types of lipid feedstocks are available in sufficient quantity (see question one at the start of this article), or b) second-generation technologies to produce RD from non-lipid feedstocks, such as Fischer-Tropsch, are available at the right price to play a part in fulfilling the mandates.
Potential European Demand for North American RD by 2025
In 2020, RD demand in Europe was about 100 KBD. The incentives and dynamics described above could easily increase demand by 50% by 2025 creating an opportunity to shift significant volumes of RD currently targeted into North American markets over to Europe. Whether this helps with the U.S. length, however, will also depend on capacity built in Europe (Total is converting a second refinery in France (Grandpuits) to RD and sustainable aviation fuel (SAF) production after converting La Mede previously).
Conclusions
If all the likely RD projects announced are developed, there will be significantly more production (over 300 KBD) than what is needed to meet projected North American demand of about 180 KBD based on currently adopted LCFS programs. However, since Europe has nearly double the demand for diesel fuel as the U.S. and has strong mandates to decarbonize its economy (in addition to a 7% biodiesel blendwall), as much as 50 KBD of this production could be placed into Europe in the next four years. Even these two markets together, however, will not absorb all of the 300+ KBD of RD coming online in the next few years without some additional market shifts. To that end, regulators such as the California Air Resources Board (CARB) could increase required CI reduction levels to take into account the increased availability of RD. It is also possible that other jurisdictions – such as Minnesota, New York, New Mexico and others – could adopt LCFS regulations to further increase demand for RD and SAF. If all of the above incentives were to be developed, it might be possible that all of the projected RD supply could find a home in an incentivized market in the U.S. or Europe. Of course, if sufficient demand does not exist, there is always the possibility that some of the announced RD projects will not be completed and brought online.
[1] LCFS credit value is an important component of RD value and also drives RD demand.