West Coast Watch: Ugly Refiner Margins Linger as Pandemic Drags On
Link to article: https://stillwaterassociates.com/west-coast-watch-ugly-refiner-margins-linger-as-pandemic-drags-on/
October 22, 2020
By Kendra Seymour and Leigh Noda
The West Coast transportation fuels market is often referred to as an island, and refiners in California and Washington face unique market pressures even in the best of times. West Coast refiners are isolated geographically, must produce gasoline and diesel to unique specifications, and are subject to greenhouse gas (GHG) reduction regulations including the federal Renewable Fuel Standard (RFS), California’s Low Carbon Fuel Standard (LCFS) and Cap and Trade (C&T) programs, and Oregon’s Clean Fuels Program (CFP). Based on these factors and with an eye toward helping stakeholders navigate this difficult market, Stillwater has developed a proprietary index to assess West Coast margins at the refinery gate. The West Coast Watch Refining Margin Index is designed around the market enclaves (Southern California, Northern California, and the Pacific Northwest), the typical crude run in West Coast refineries, the cost of compliance with GHG-reduction regulations, and the local refined product prices.
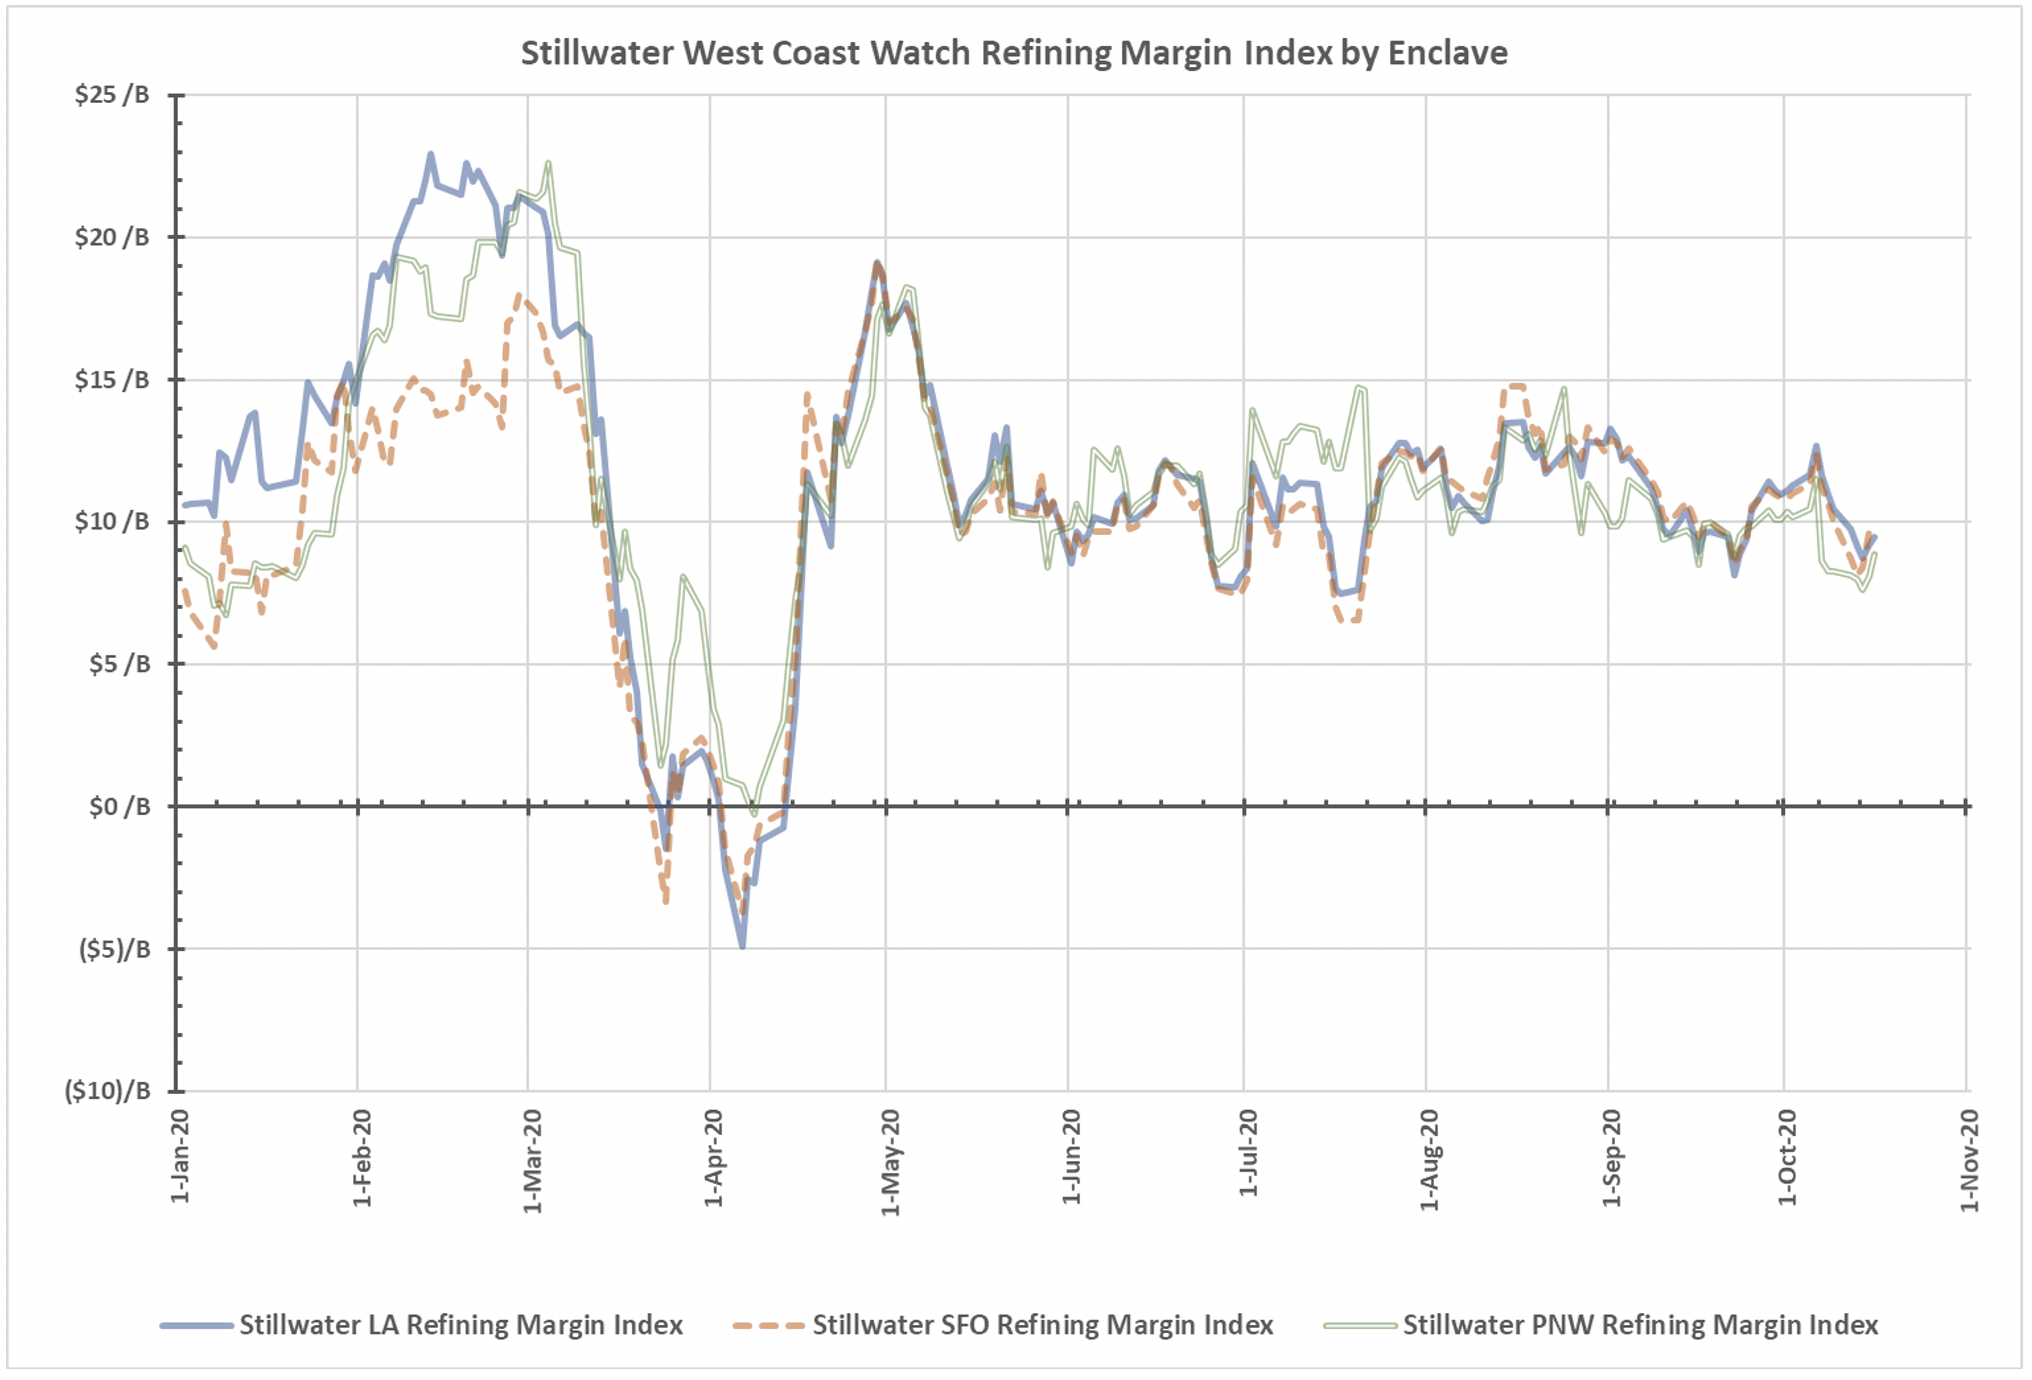
West Coast Refining Index Rose Slightly Then Fell Again in October
Depressed margins for West Coast refiners linger as the pandemic drags on. Since we introduced the West Coast Watch Refining Index in August, indices for all three enclaves, Northern California, Southern California, and the Pacific Northwest, have trended slightly down. The September average Refining Margin Index for Southern California refiners was $10.46/bbl, while the average for October-to-date is $10.37/bbl, a decline of $0.11/bbl. The September average Refining Margin Index for Northern California refiners was slightly better than those in Southern California at $10.64/bbl. For October-to-date, the average Northern California Refining Margin Index has fallen by $0.60/bbl and is below Southern California at $10.04/bbl. The Pacific Northwest has seen the steepest decline, losing $0.87/bbl from the $9.86/bbl average in September to $8.99/bbl average so far in October. Furthermore, PADD 5 (West Coast) refinery utilization for the week ending October 16th was 71.8%, down from 88.8% a year earlier.
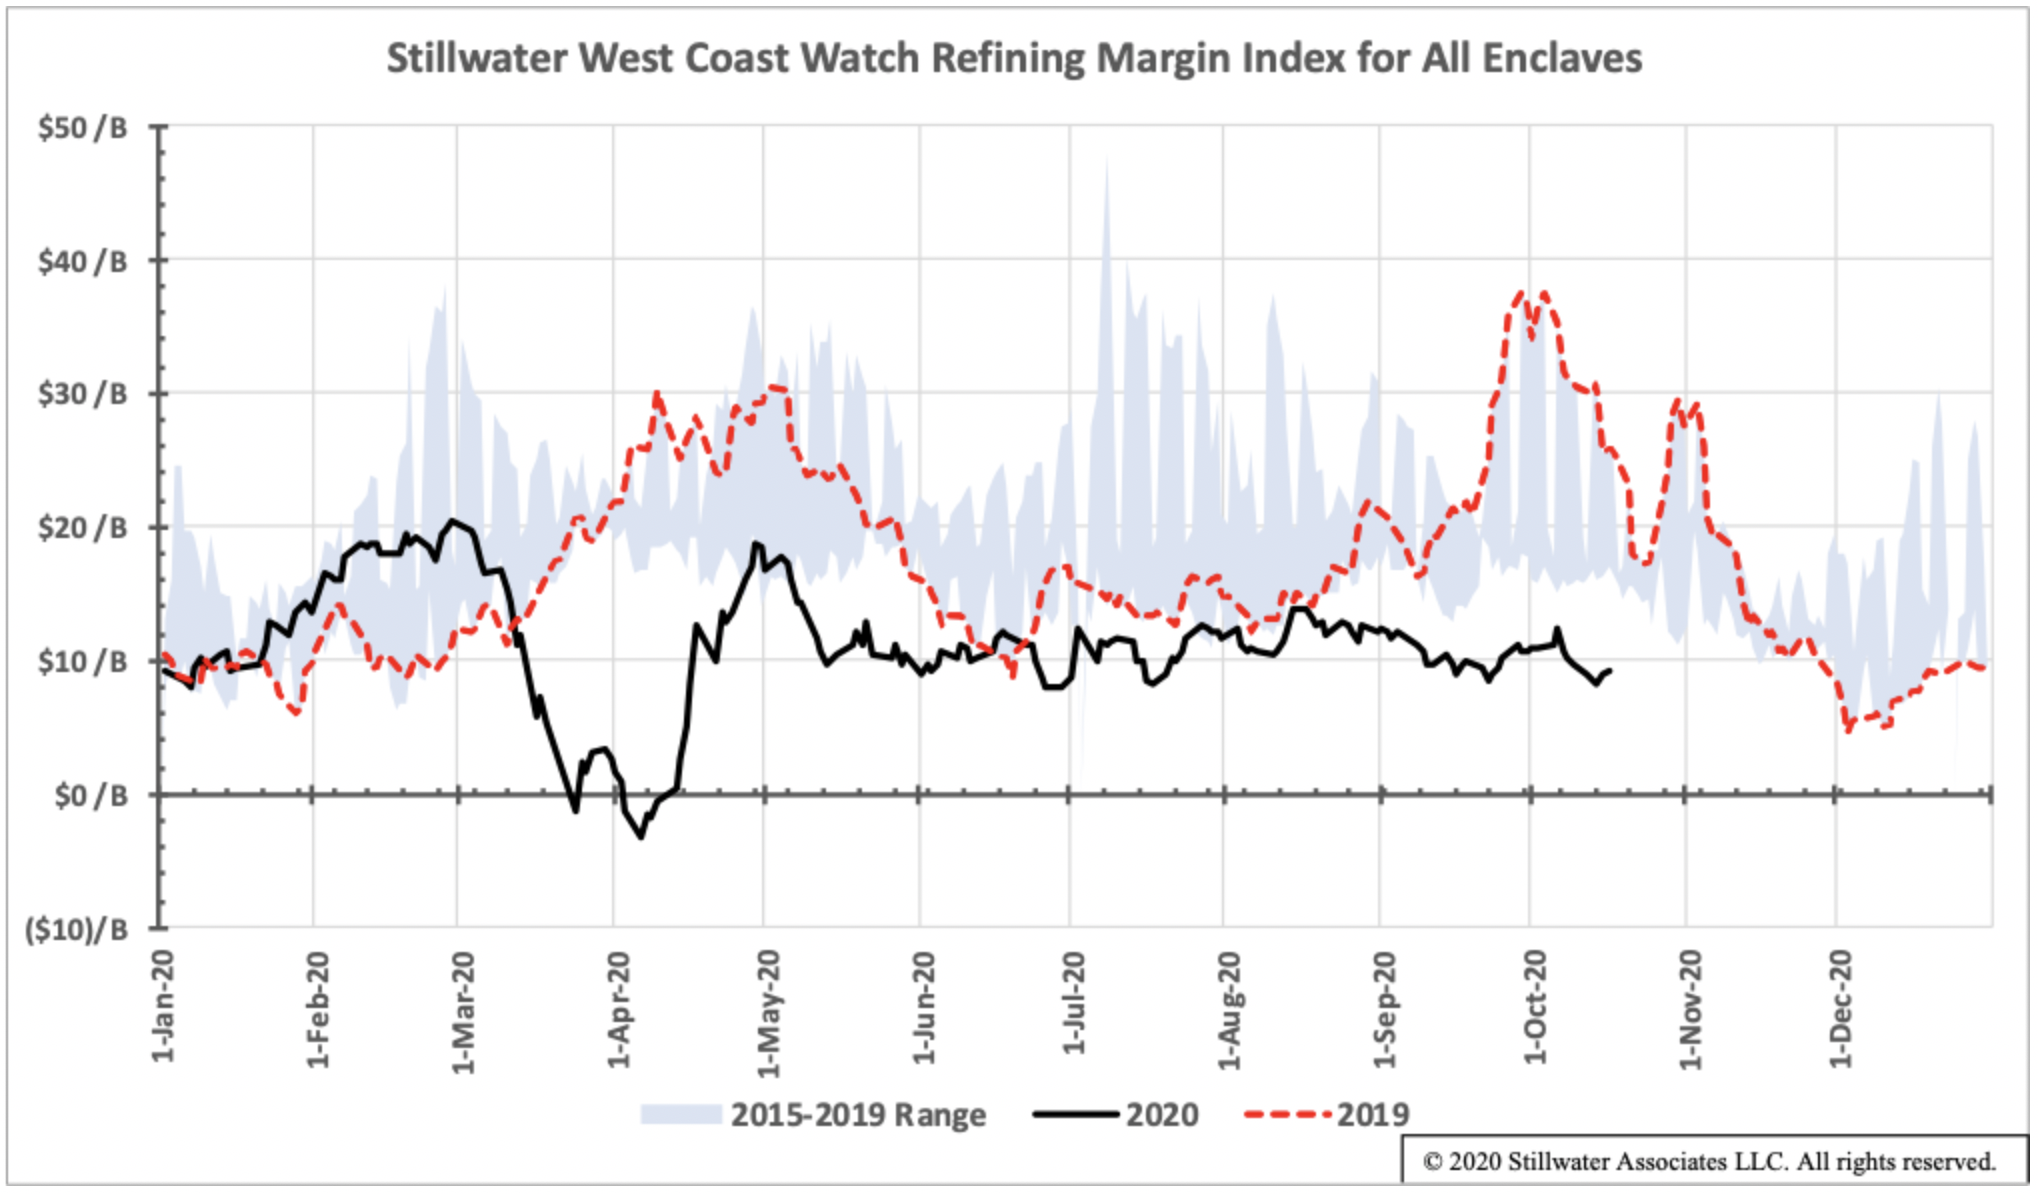
The chart below provides a broader picture with some historical context, showing the five-year weighted average index range for the entire West Coast (all three enclaves) along with the trends for 2019 and 2020. Since the big dip into negative territory at the beginning of the pandemic shut-down in late March, there has been some improvement as the 2020 indices have been closer to the bottom of the five-year range through the first part of October. The average West Coast Margin Index for September was $10.37/bbl, about a 55% decrease from the September 2019 average of 23.20/bbl. The Margin Index for October has also slipped compared to September 2020 and October 2019, with the average for October-to-date at $9.93/bbl. This is a 4% decrease from September 2020 and a 64% decrease from the same period last year of $27.77/bbl when there were refinery issues. Since mid-May, after the shock of dramatic demand reductions and extremely high product inventories, the industry adjusted to the new norm of reduced demand and reduced refinery rates, the West Coast Margin Index has averaged $10.75/bbl. When considering the average since mid-May to the low points of the historical range, it appears that the steady-state floor to the West Coast Refining Margin Index is about $10.00/bbl.
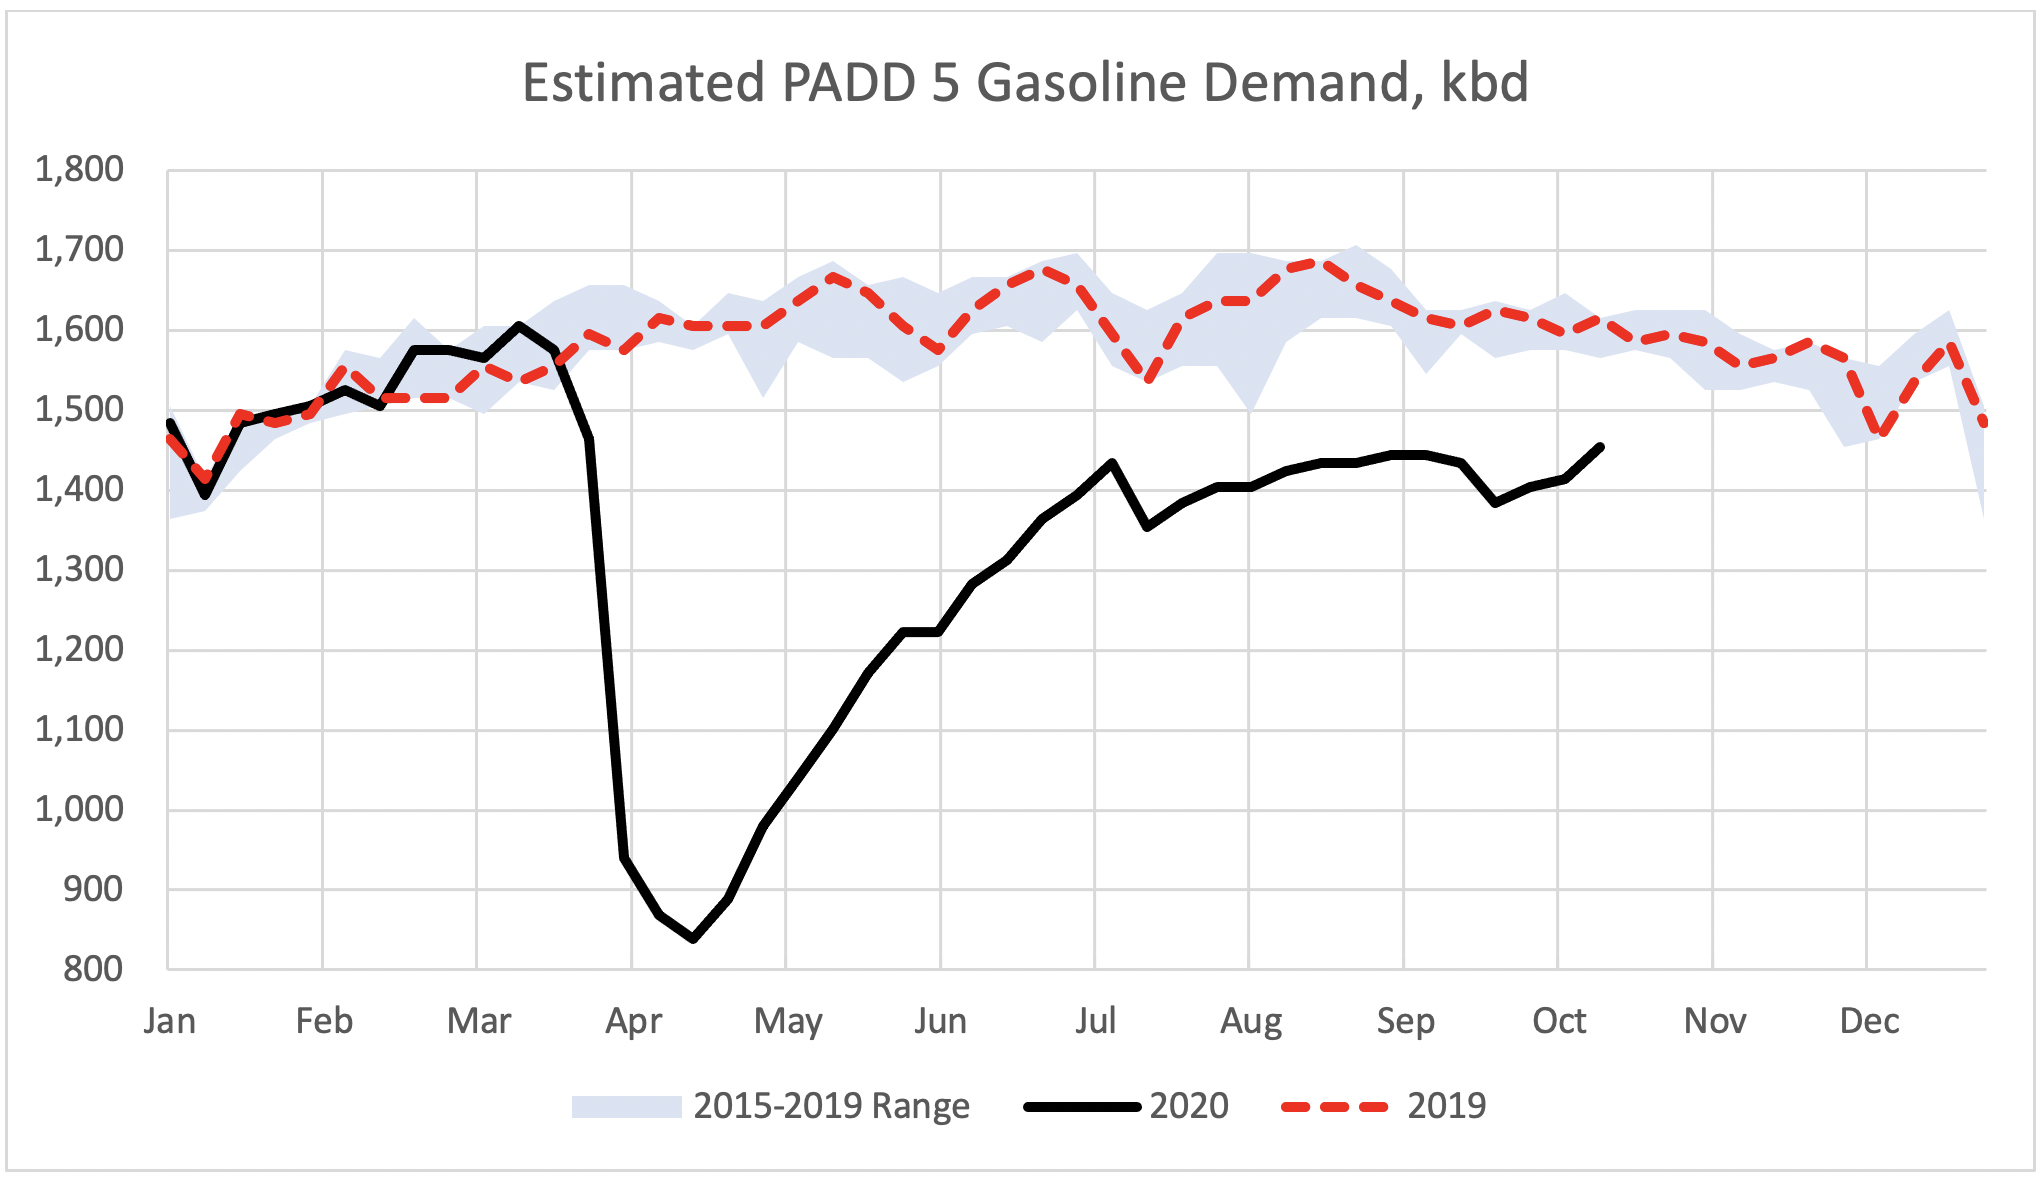
Demand is still well below average, driving margin collapse
The steep decline in demand caused by the pandemic is driving refining margin collapse. The demand trend is illustrated by PADD 5 gasoline demand data provided by the U.S. Energy Information Administration (EIA) below. Demand bottomed out in mid-April due to the pandemic, hitting about 52% of the same week in 2019. Since then, gasoline demand has improved from 88% of 2019 volumes at the end of August. The latest week gasoline demand represents 90.4% of the same week last year and represents a slow recovery of gasoline demand compared to 2019.
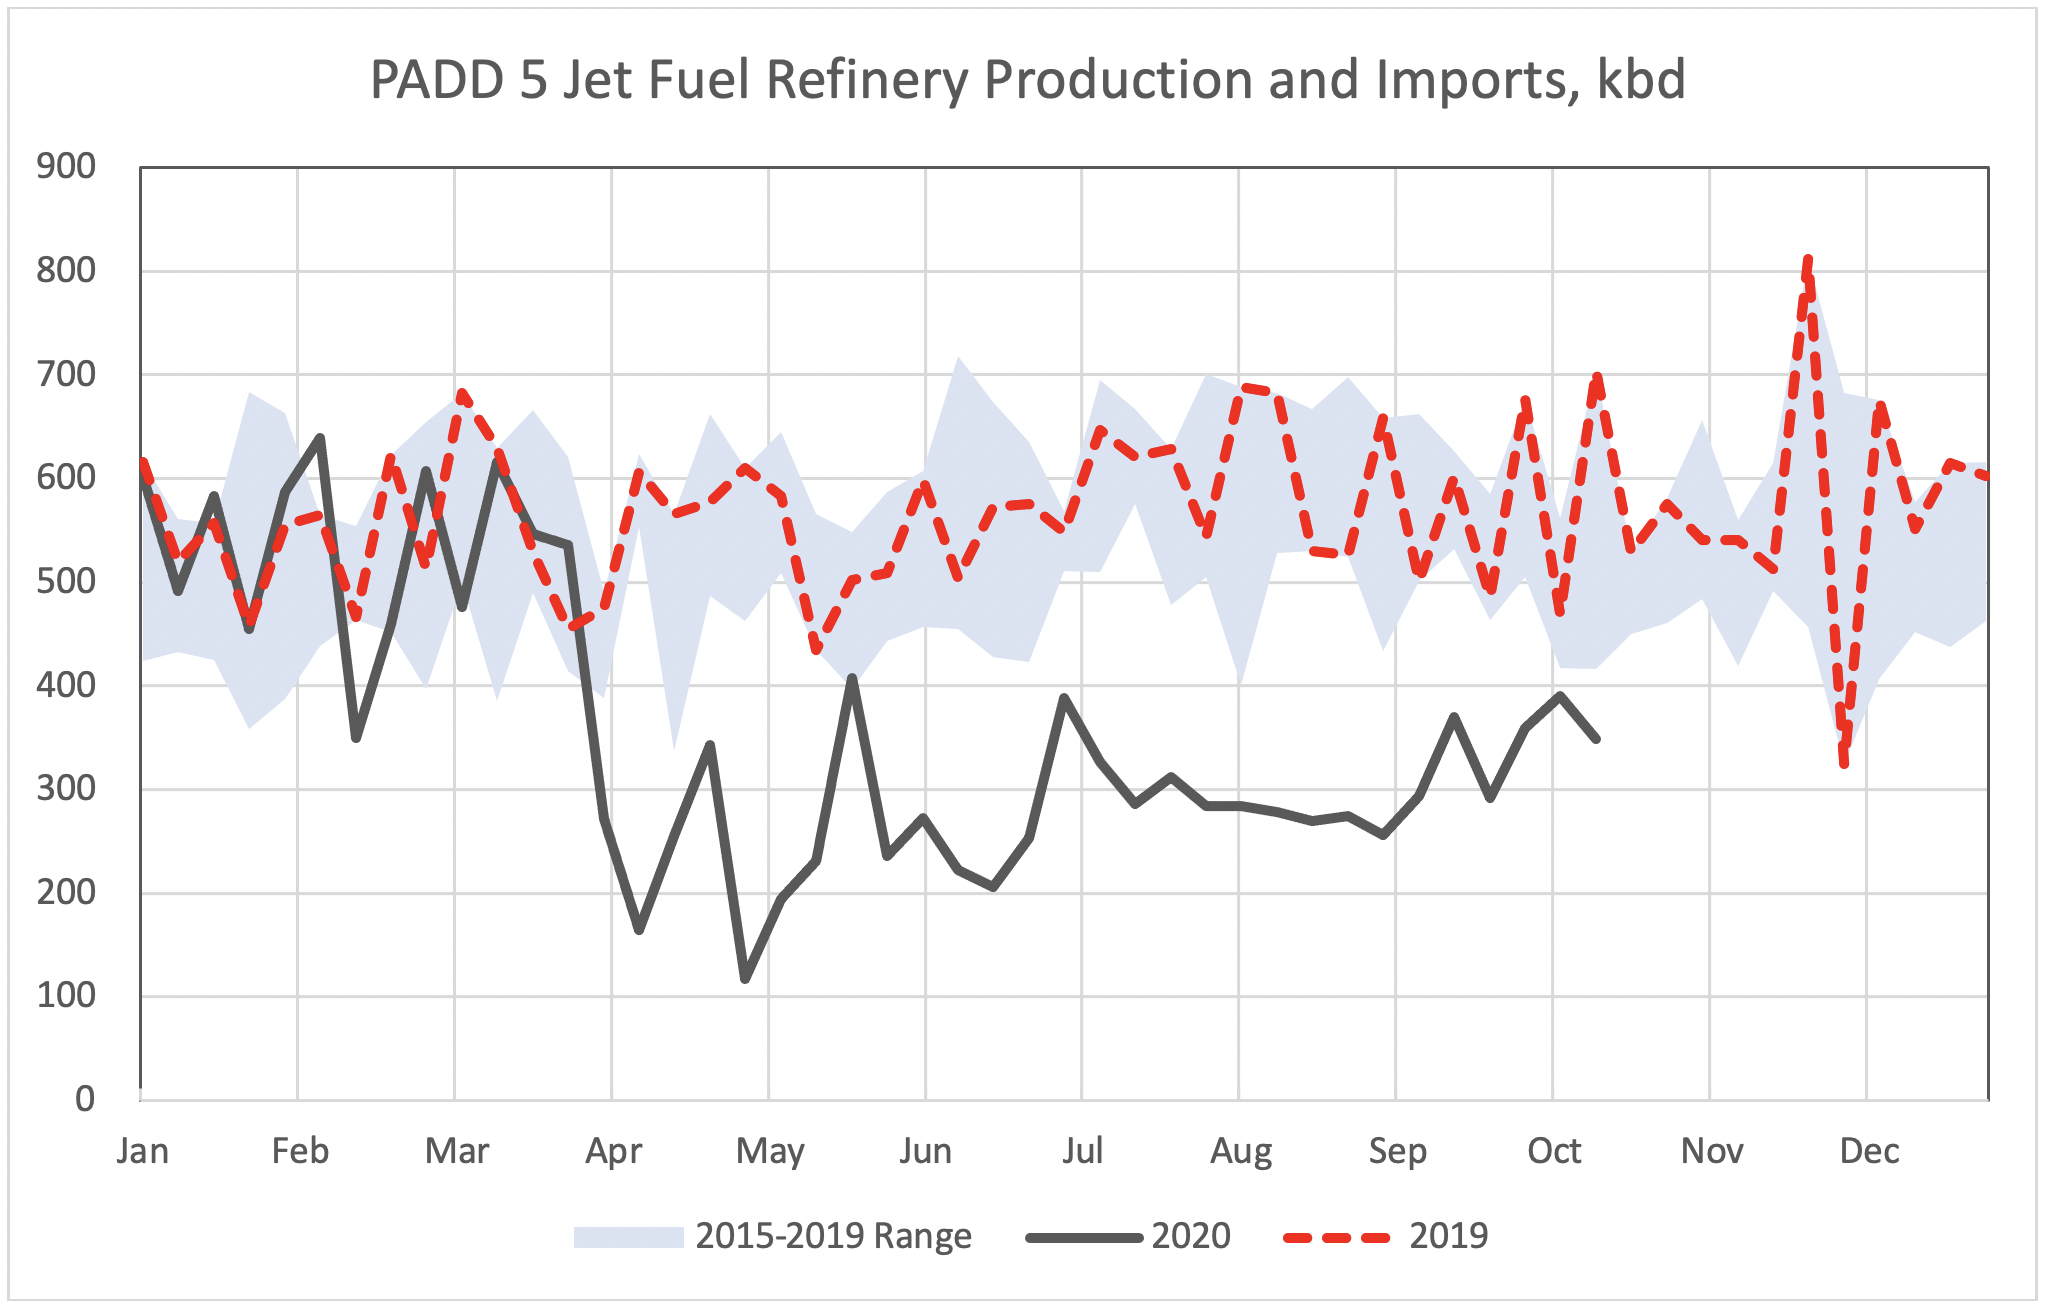
Since we last reported on our estimation of jet fuel demand (calculated as production plus imports) for the West Coast last month, we’ve seen a slight improvement to the dismal jet fuel picture. The production and import of jet fuel represent a good proxy for PADD 5 jet fuel demand as exports are historically flat and limited in the range of up to 30 kbd. The demand trend is illustrated by the EIA PADD 5 data, displayed below. Jet demand averaged about 225 kbd in August, or about 38% of demand at the same time in 2019. For the first half of October, jet demand improved to about 368 kbd, or 61% of demand at the same time in 2019 at 606 kbd.
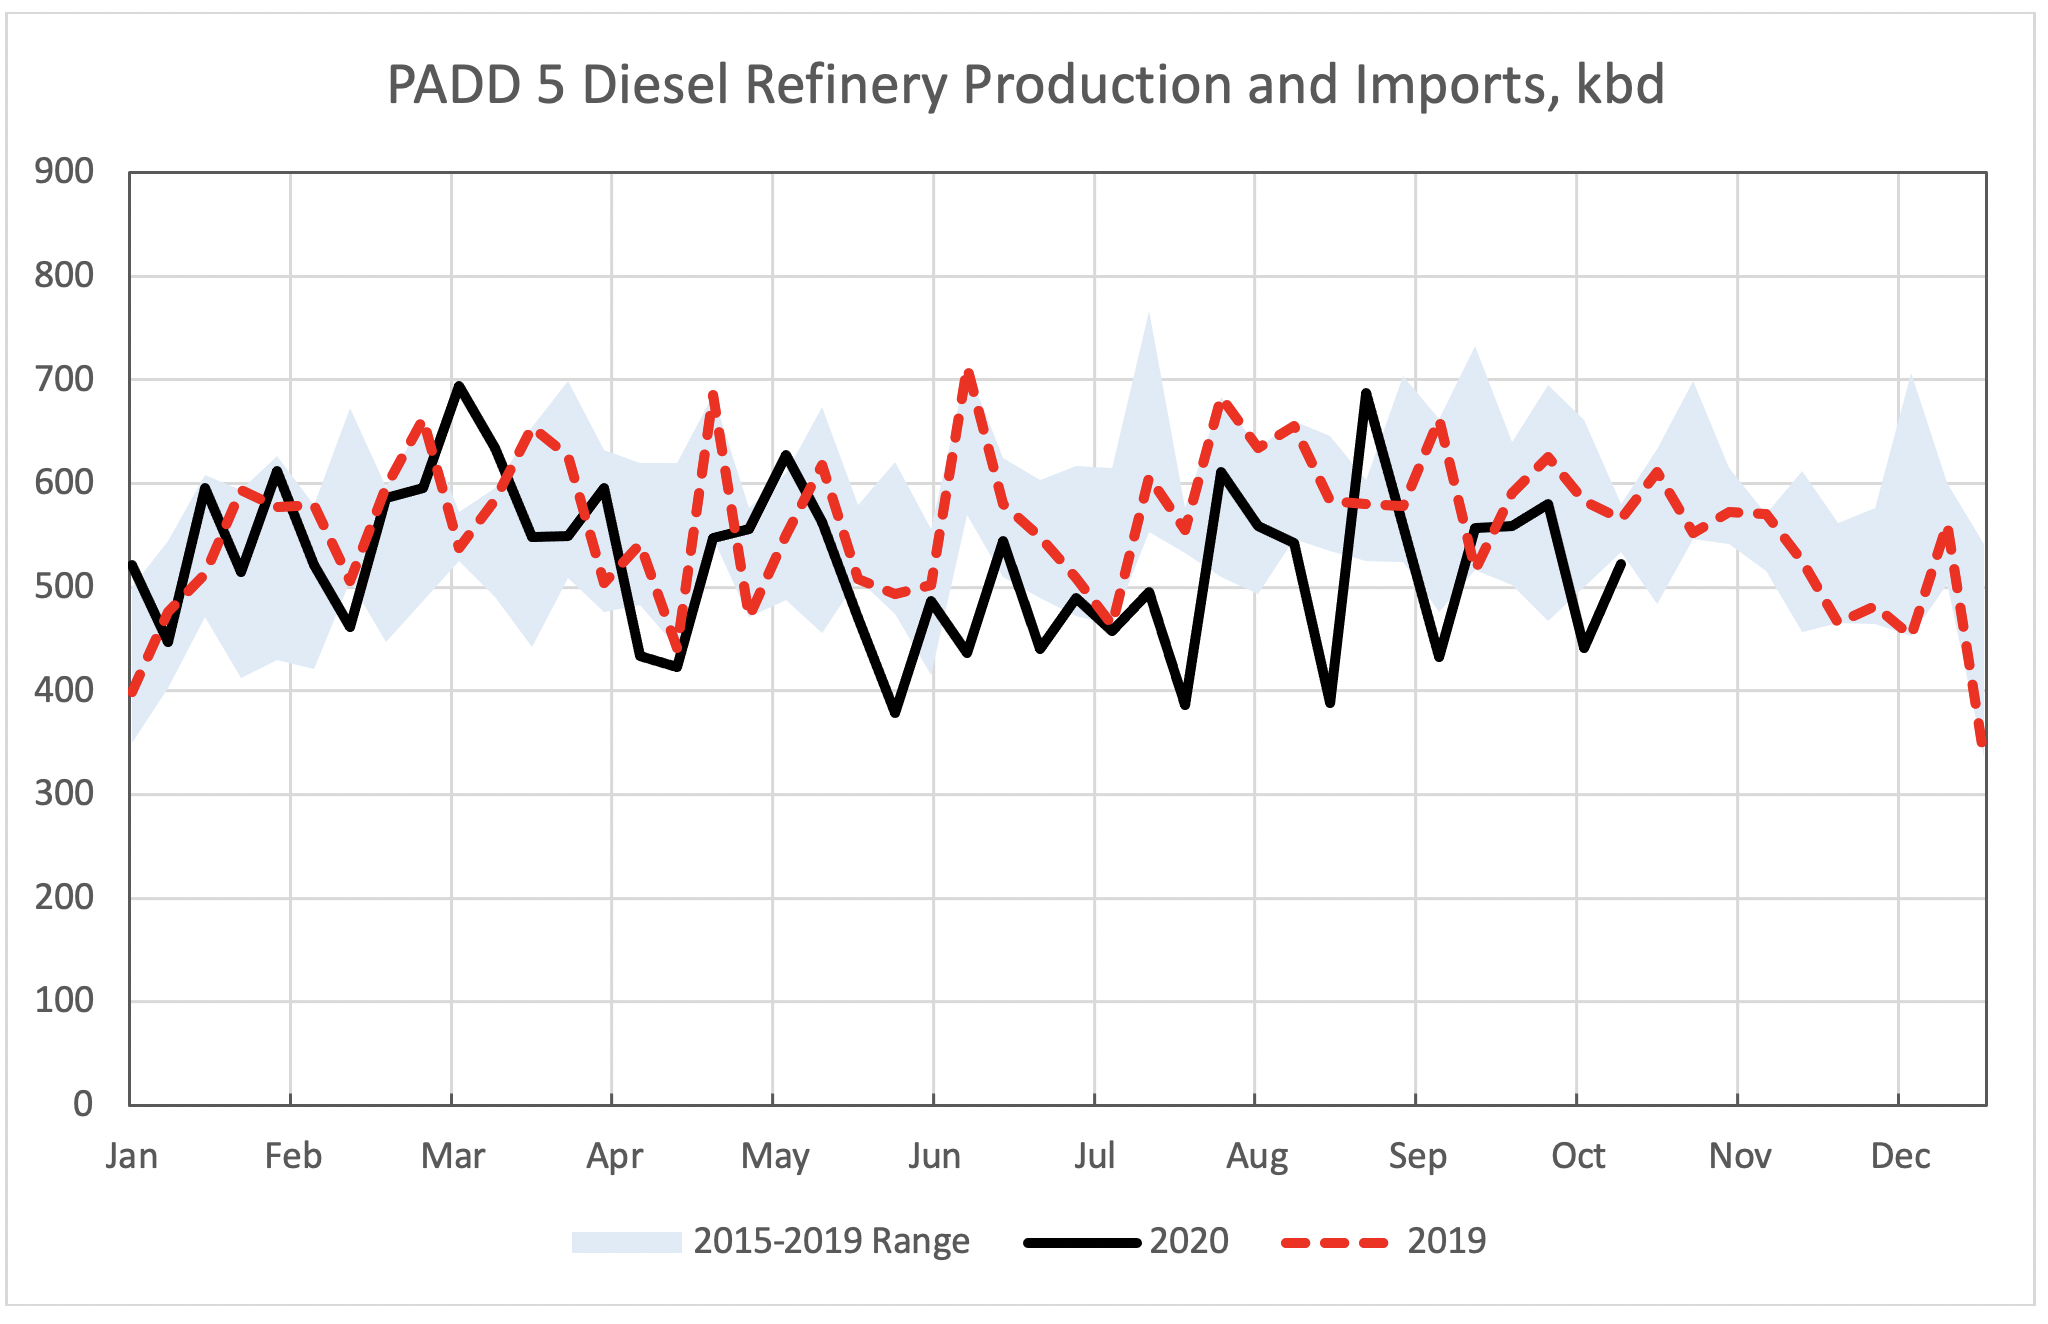
This month we are introducing the PADD 5 Diesel Refinery Production and Imports chart. Unlike the gasoline chart which has a methodology to accurately track demand and the jet chart which would be off by a small amount of jet fuel exports, the diesel chart represents the supply of diesel from refinery production and imports. In PADD 5, there is only a small amount of imported diesel. However, diesel exports are significant and historically have been 20-25% of supply. As shown in the figure below, diesel production plus imports shows that this fuel has not been hit as hard by the pandemic as gasoline and jet fuel. This view is also supported by monthly demand data for these fuels in PADD 5.
Based on the data Stillwater tracks each week, the West Coast has begun to recover from the shock of the COVID-19 demand reductions with gasoline and jet fuel slowly gaining back some of the lost demand, and diesel rebounding to prior demand levels. The prevailing question continues to be: Will the current level of demand be sufficient to keep existing refineries running at a high enough utilization to improve margins? We’ll be following market developments closely in Stillwater’s West Coast Watch.
Tags: Refining Margin Index, Refining Margins, WCW, West Coast, West Coast WatchCategories: Economics, Mergers and Acquisitions