West Coast Gasoline – Have we reached the bottom?
Link to article: https://stillwaterassociates.com/west-coast-gasoline-have-we-reached-the-bottom/
May 7, 2020
By Dave Hackett
I started the first article in this series on April 15th with a question: “When was the last time you filled up?” Well, I still have not had to fill up either car, but I am down to a quarter tank on mine. Maybe this week.
From a gasoline perspective, the fallout from COVID-19 remains a demand crisis, not a supply crisis. However, weekly U.S. Energy Information Administration (EIA) demand stats indicate that demand may have bottomed out.
Figure 1. Estimated Weekly PADD 5* Gasoline Demand (in thousand barrels per day, KBD)
* Petroleum Administration for Defense District (PADD) 5 is the western U.S.
Retail prices for gasoline have fallen along with demand. West Coast Reformulated Regular – the type of gasoline sold throughout California and in Phoenix, AZ – is down to $2.54 according to the EIA today. This price is off 69 cents per gallon (cpg) since the lockdown started. There is evidence that the retail price slide has ended, but that isn’t borne out in this week’s EIA data, as shown in the figure below.
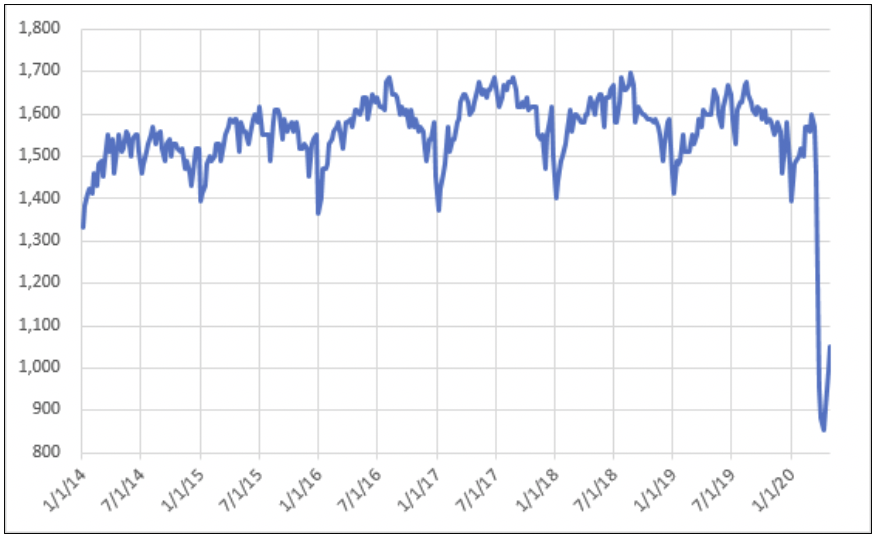
Figure 2. PADD 5 Reformulated Regular Gasoline Retail Price ($/gallon)
Spot prices mark the cost of gasoline at the first place it trades – the refinery gate. According to the EIA, the spot price of regular in Los Angeles dropped as low as $0.29 per gallon but has rebounded to $0.86 per gallon as refineries are producing less gasoline and demand is looking to recover.
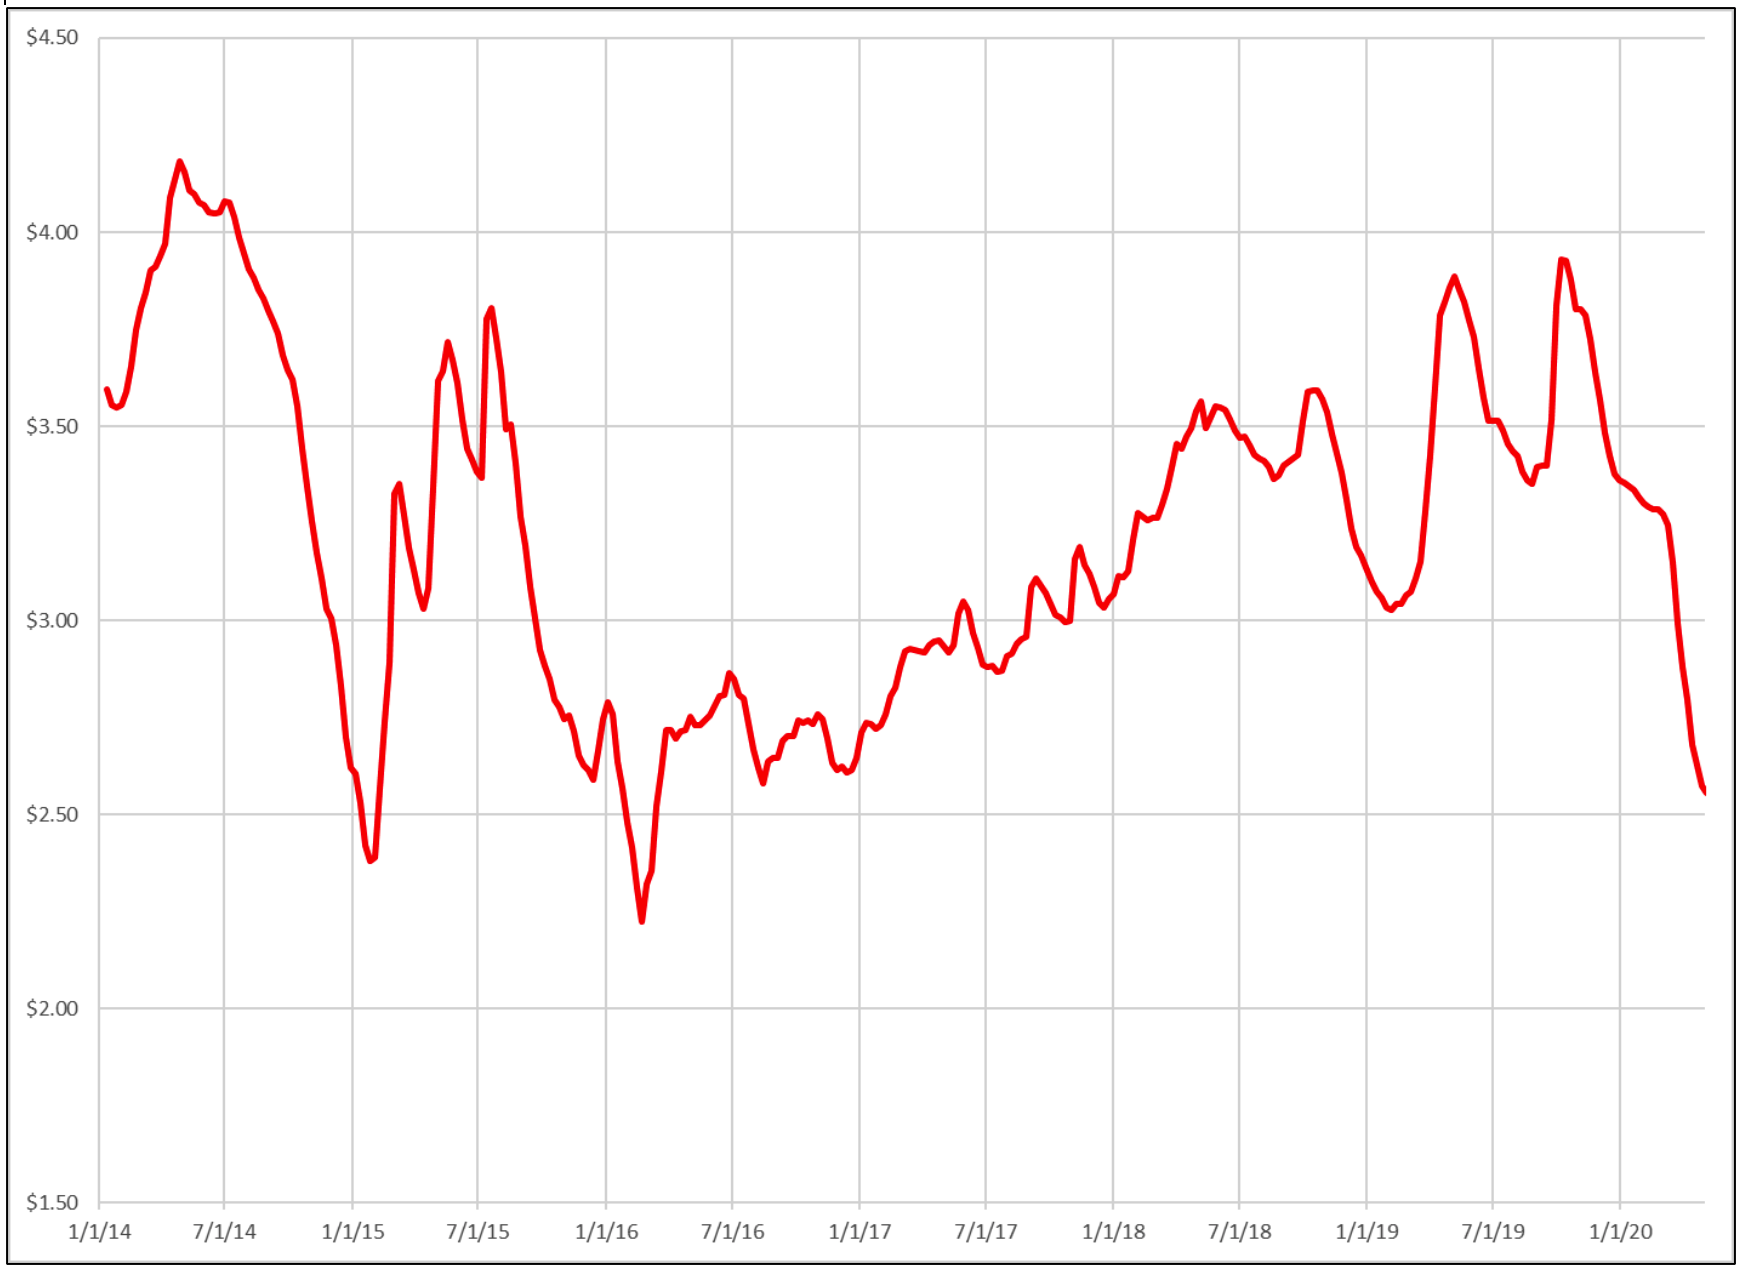
Figure 3. Los Angeles RBOB Regular Gasoline Spot Price ($/gallon)

While not shown here, the spread between the LA spot price and the NYMEX futures exchange has improved to roughly even. This is an indicator that the market is no longer in huge distress.
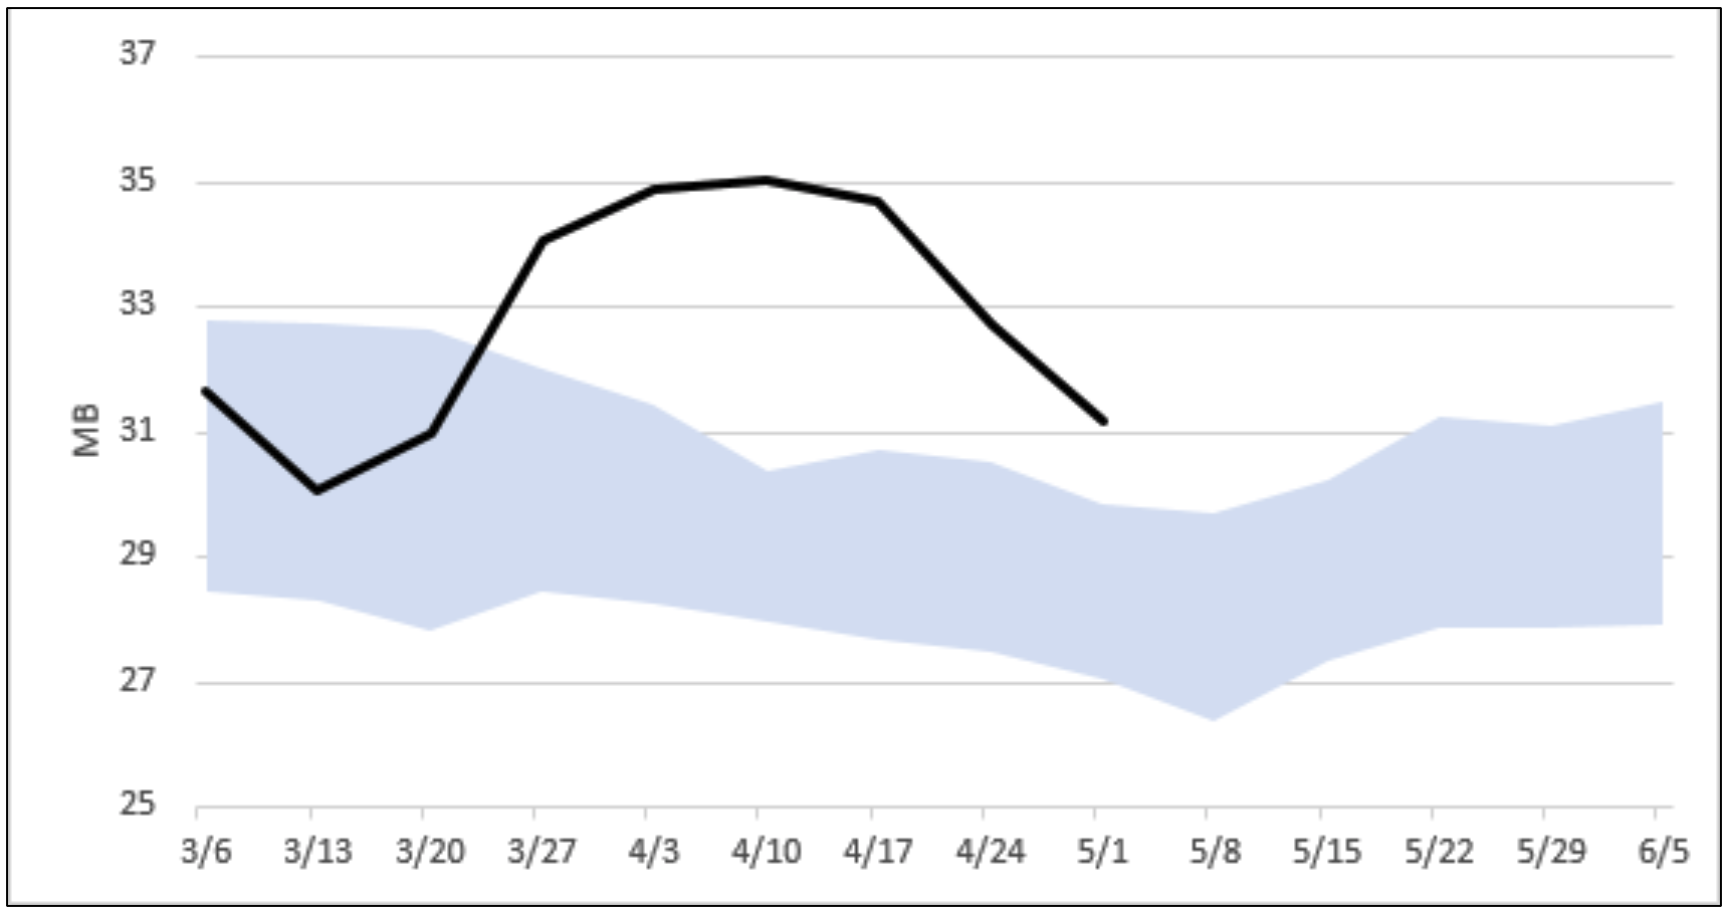
When demand dropped dramatically, gasoline inventory built strongly for three weeks, as shown in the figure below, then inventory started to drop as gasoline production was cut. Currently, total gasoline in storage is at 31.1 million barrels (MB), a decrease of 3.8 MB from the peak, but well above normal inventory ranges.
Figure 4. PADD 5 Gasoline Inventory and Five-Year Range
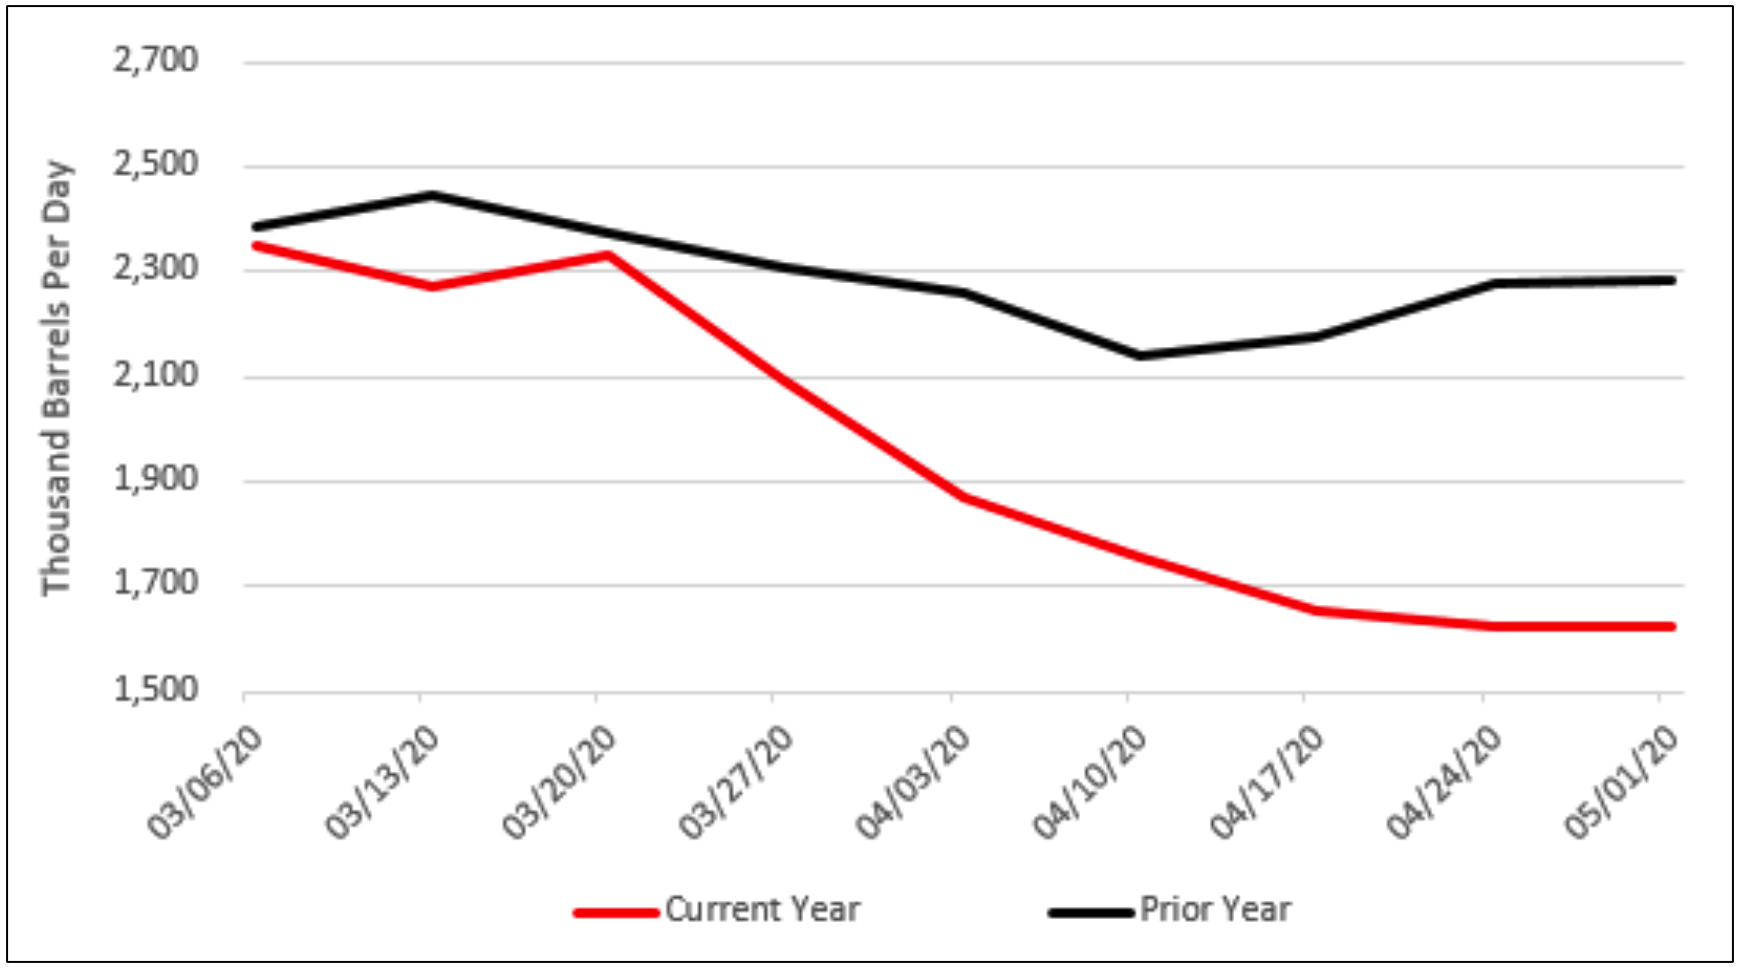
What has caused the decline in gasoline inventories? Refiners cut crude oil runs starting in late March. Most refineries throttled back on crude, but several refineries shut down either partially or completely. These include Marathon Martinez and Chevron El Segundo. Crude runs at the 1,622 KBD level are roughly 61% of the maximum the refineries have run in the last five years.
Figure 5. PADD 5 Crude Runs – Feb 28 – May 1, 2020 (KBD)
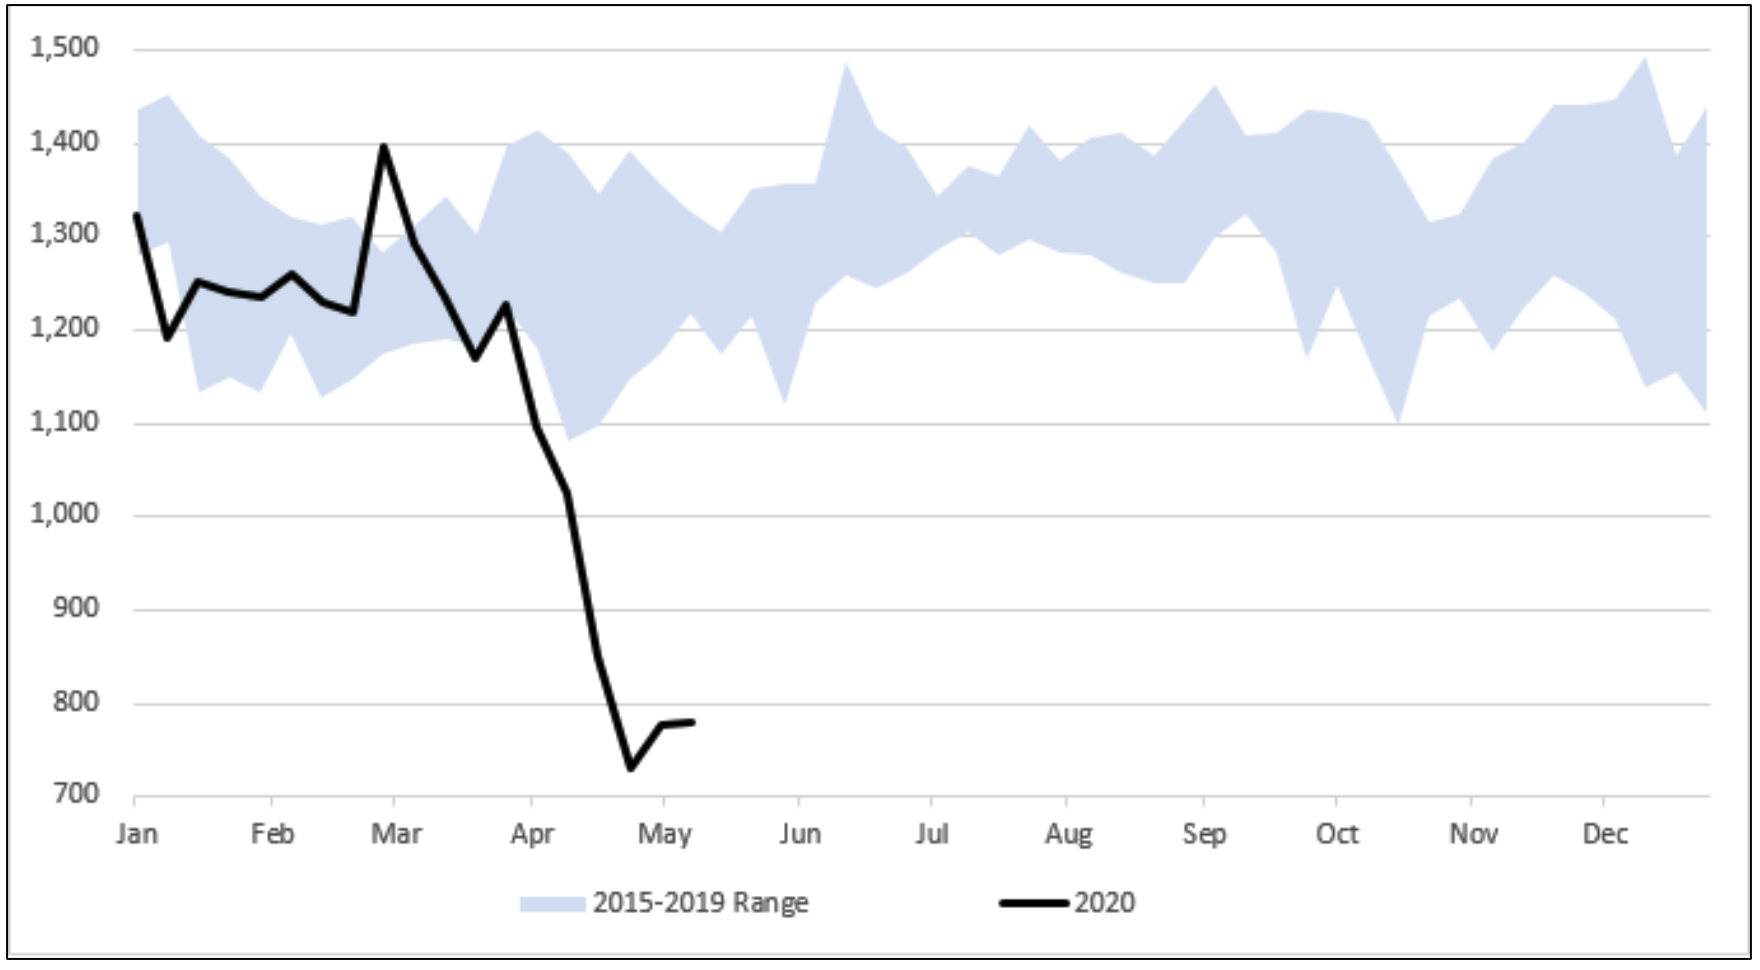
The result is that gasoline production bottomed out at about 730 KBD and recovered to about 780 KBD this last week. Refiners have successfully reduced gasoline production to below gasoline demand, resulting in a draw-down in gasoline inventory, as shown above.
Figure 6. Estimated Weekly PADD 5 Refinery Gasoline Production (KBD)
So, all of this begs the questions: How low can prices get, and how long will gas stay cheap? For California, retail gasoline prices could fall to below $2.00 per gallon if spot prices remain at these low levels. (It is worth noting that, currently, California’s taxes and climate change fees make up about $1.00 of the per-gallon cost to consumers.) Gas prices will stay low until the high gasoline inventory levels drop to more normal levels. That could take months.
Want more information or a deeper dive into the data and trends? Contact us to find out how our experts can help you make wise decisions in these unparalleled times. Stillwater Associates see things others miss because we’ve “been there and done that.”
Tags: coronavirus, COVID-19, Gasoline, Gasoline Pricing, gasoline retail price, InventoryCategories: Economics, Wisdom from the Downstream Wizard