The U.S. Side of the U.S.-China GHG Agreement: The Impossible Dream
Link to article: https://stillwaterassociates.com/the-u-s-side-of-the-u-s-china-ghg-agreement-the-impossible-dream/
February 23, 2015
by Dave Hirshfeld, MathPro Inc.
In November 2014, the Presidents of the U.S. and China agreed to new curbs on the two countries’ greenhouse gas (GHG) emissions, stating that:
- “The U.S. intends to reduce its emissions by 26%-28% below its 2005 level by 2025 and to make its best efforts to reduce its emissions by 28%.”
- “China intends to achieve peaking of its emissions around 2030 and to make best efforts to peak early and intends to increase the share of non-fossil fuels in primary energy consumption to around 20% by 2030.”
The agreement received a mixed reception in the U.S. Adherents of catastrophic man-made global warming theory hailed the agreement, some calling it “a deal to save the planet.” Other observers dismissed the agreement, noting that it is non-binding, is not to be codified in either law or treaty, is unlikely to win necessary political support, and appears intended mainly to buttress the U.S. negotiating position for the U.N. climate conference (COP21) later this year.
Partisanship aside, are the goals and timetables set forth in the U.S.-China agreement feasible? In particular, if adherence to the agreement were to become U.S. national policy, could the U.S. slash its GHG emissions by 26%-28% relative to 2005 emissions by 2025?
The answer is almost surely no. The U.S. “intent” is an impossible dream. (Or, if you’re an optimist, a highly improbable dream.)
This assessment is based on an analysis using historical values and projections of U.S. CO2 emissions from EIA’s Annual Energy Outlook 2013 (AEO2013).
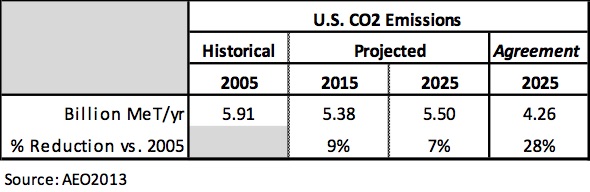
As the above table indicates, U.S. CO2 emissions were 5.91 billion metric tons (Bil MeT) in 2005 (the baseline for this analysis). EIA projects CO2 emissions to decrease to 5.38 Bil MeT/yr by 2015 and then increase slightly to 5.50 Bil MeT/yr by 2025.1 The intended 28% reduction from the 2005 baseline would put 2025 CO2 emissions at 4.26 Bil MeT/yr – 1.65 Bil MeT/yr less than in 2005 and 1.24 Bil MeT/yr less than EIA projects for 2025.2
Achieving the U.S. side of the U.S.-China agreement would mean generating additional reductions of 1.24 Bil MeT/yr in U.S. CO2 emissions between now and 2025, in addition to the projected reductions from existing regulatory programs and economic factors. The bar chart below (in which each bar denotes a projection of U.S. CO2 emissions, by sector) shows what it would take to achieve an additional decrease of 1.24 Bil MeT/yr by 2025.
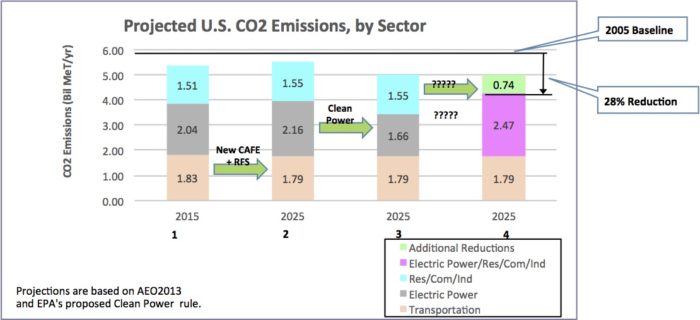
Achieving the intended 28% reduction would call for significant emissions reduction in every sector of the U.S. economy, with most of the reductions to be driven by laws and regulations that either are not yet in force or even proposed.
Projections 1 and 2 are AEO2013 projections of CO2 emissions by end-use sector, for 2015 and 2025, respectively. In Projection 2, the new CAFE standards (primarily) and the RFS lead to the indicated small decrease in CO2 emissions in the transportation sector, partially off-setting small increases in the other sectors between 2015 and 2025.3 4
Projection 3, another projection for 2025, indicates an additional reduction in CO2 emissions of 0.5 Bil MeT/yr — all in the electric power sector. Projection 3 reflects full implementation of EPA’s proposed Clean Power Plan, aimed at reducing CO2 emissions from existing power plants by about 30% of the 2005 level by 2030.
Projection 4, yet another projection for 2025, indicates the additional reductions in CO2 emissions – about 0.74 Bil MeT/yr – that would be needed to achieve the desired 28% reduction from the 2005 baseline. The additional reduction is shown as coming from some combination of all sectors except transportation, by means of as-yet unspecified new CO2 emissions reduction program or programs.
The transportation and electric power sectors seem to offer little additional opportunity over the next decade for emissions reductions beyond those generated by the new CAFE standards and Clean Power Plan, respectively – assuming they go into effect as planned. The new CAFE standards are subject to a statutory “mid-term” review in 2017. This review could result in a relaxation of the fuel economy standards, as some auto industry advocates call for. The proposed Clean Power Plan is in litigation in the federal courts, which may delay or prevent its implementation.
The additional reductions would have to be achieved through either or both of (i) more stringent CO2 controls on the electric power sector (as environmentalists are calling for) and (2) a new set of CO2 controls on the residential, commercial and industrial sectors. All of these sectors would have to be addressed with new, as yet unspecified, CO2 emissions reduction programs. These programs would have to be in force within the next few years, and they would have to be extremely stringent. The required reduction of 0.74 Bil MeT/yr is about 14% of projected total U.S. emissions in 2025, half again as large as the reduction under the proposed Clean Power Plan and almost half of total CO2 emissions in the residential, commercial, and industrial sectors.
The administration has provided no clues regarding new CO2 control programs for achieving the 28% reduction that would be realistic in social, political, economic, and technical terms.
(“The Impossible Dream” is the featured song of the Broadway musical, “Man of La Mancha”, which recounts the story of Don Quixote, a man of lofty ideals and a fixation on windmills.)
_______________________________________________________________________________________________________
1These projections come from EIA’s Annual Energy Outlook 2013 (AEO2013). The projections in AEO2014 are essentially the same in numeric terms.
2These projections, like all EIA projections, reflect federal and state laws and regulations in force at the time of publication, but not proposed or prospective laws. Thus, the projections reflect the RFS (enacted in 2007), the new CAFE standards for cars and light-duty trucks (enacted in 2012), and state regulatory programs established under California’s AB32 – but not, for example, the administration’s proposed Clean Power Plan.
3The new standards call for 2025 cars and light-duty trucks to have average fuel economies of about 55 mpg and 40 mpg, respectively, with a combined average fuel economy of just under 50 mpg.
4The projected emission reductions in the transportation sector are small because (i) by 2025 vehicles meeting the new fuel economy standards will make up only a small portion of the vehicle fleet and (ii) the new standards do not affect the rest of the transportation sector.
Tags: Renewable Fuels Standard, RFS, White PaperCategories: Policy, White Papers