The Cost of Premium
Link to article: https://stillwaterassociates.com/the-cost-of-premium/
February 9, 2018
Stillwater Associates is often retained to analyze markets. Currently, we have a project for the Fuels Institute to look at the demand for higher octane gasoline in the future. This analysis is driven by the growing demand for higher octane gasolines that cars increasingly need to maximize the performance of their turbocharged engines.
In thinking about the issue, I thought it would be interesting to look at the cost of premium gasoline. To filter out the cost of crude, I decided to compare the cost of premium with the cost of regular. The first analysis was to look at the retail premium/regular spread in four markets tracked by the U.S. Energy Information Administration (EIA). A 10-year plot of the retail spreads is shown below.
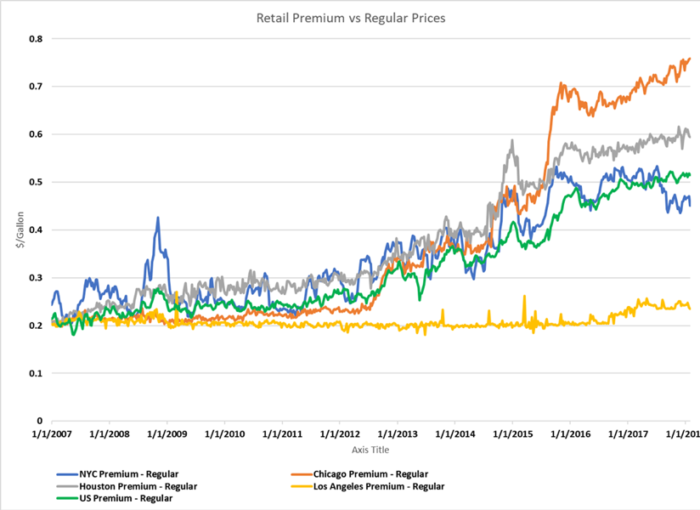
In 2007, most of the spreads were at about 20 cents per gallon (cpg). Over time, the spreads have gradually increased, except in Los Angeles, which stayed at 20 cents until 2017. I note that premium in the West is 91 Road Octane, while New York City (NYC), Chicago, and Houston are generally 93 Road Octane.
Interesting, but why are these so different? The first place to look is to the spot price. Below is the spot market spread for the four markets:
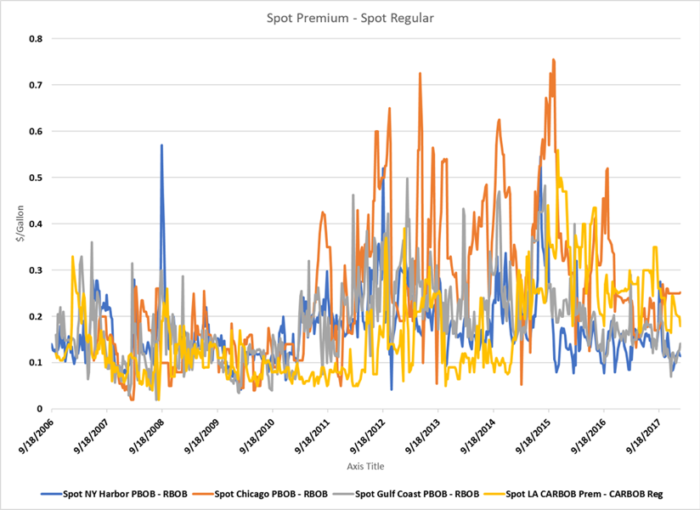
Those spreads are volatile because they represent spot-in-time changes in supply, generally related to refining problems.
To reduce the noise in the spot spreads, we show them in annual averages:
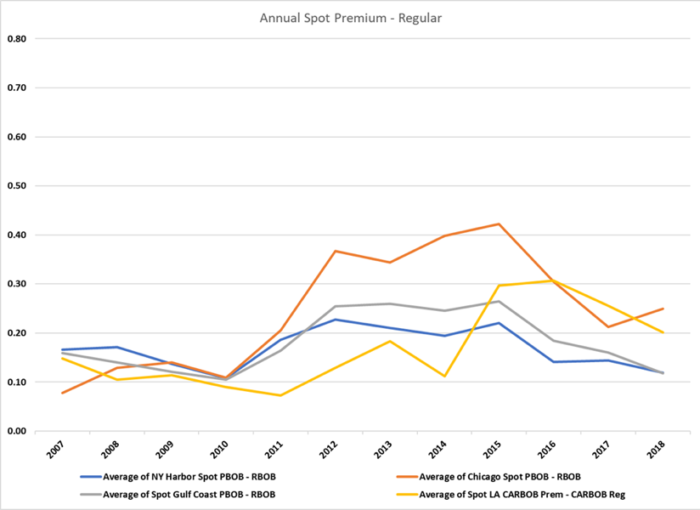
These spreads peaked in 2015 or 2016 and range from 12 to 25 cpg today. The cost to manufacture premium has gone up for many reasons. One is that refineries are processing more shale crude, which has lower octane potential than traditional crude oils. Also, the demand for octane has increased, stretching the refining industry’s capability to make premium.
Drilling down to the regional levels, we compared retail and spot spreads for the four markets, using monthly data. The spreads for Houston and NYC are similar.
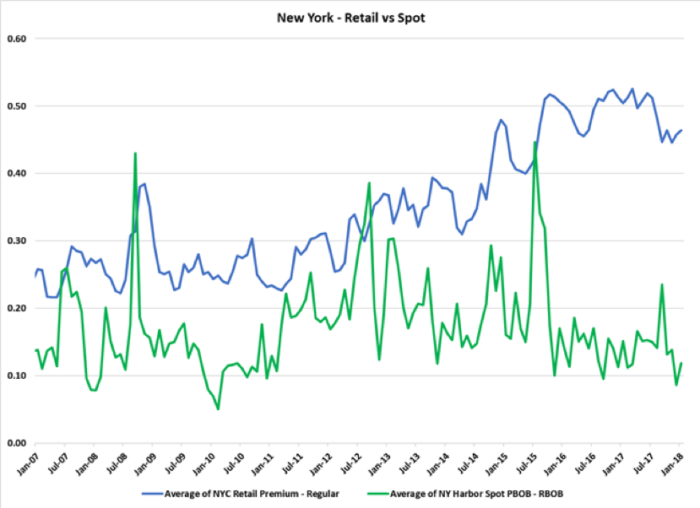
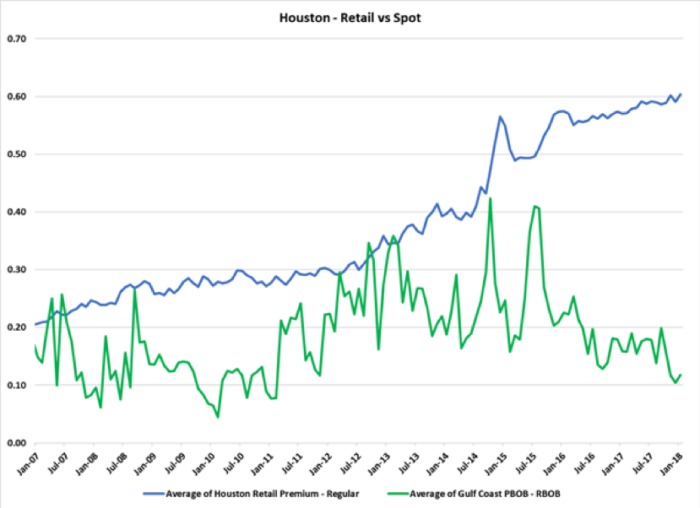
The blue line is the retail premium/regular spread. This represents the retailer’s margin on premium. The green line is the spot premium/regular spread. This represents the refiner’s margin. Looking at the curves, you can see several places where high spot prices drove up retail prices. However, at this point, the spot price spreads are trending down but retail price spreads are staying up.
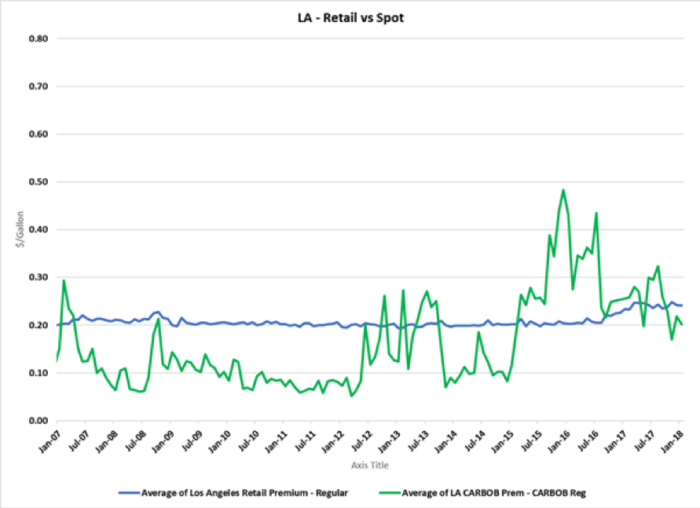
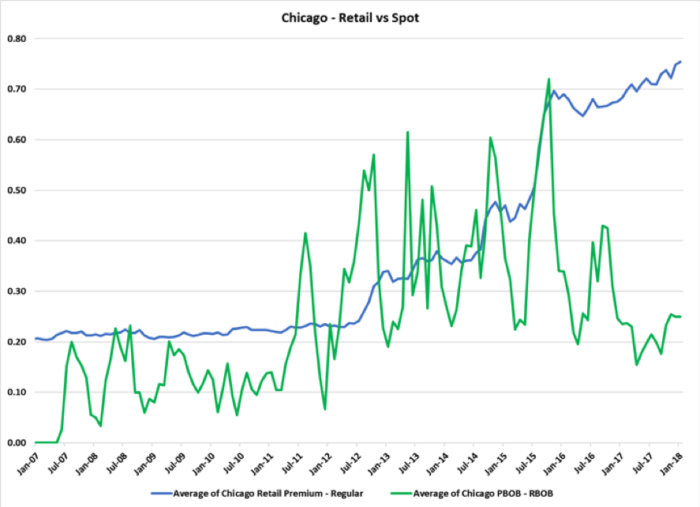
Chicago and LA plots show very different markets. In Chicago, you can see how increasing spot spreads resulted in a typical reaction at retail. In 2015 a spike in the spot spread resulted in a big increase at retail. The spot spreads have fallen away, but the retail spread continues to increase. On the other hand, the retail market in LA seems to have been nearly impervious to the spot market until recently. Marketers in LA have not enjoyed the margin in premium that their colleagues in the East have enjoyed.
A question that comes from this analysis is: Will retail premium margins in the East continue? Or, will competition return margins to a more historic level? As well, will the margins in LA creep up like they have in the East? Stay tuned.
Categories: Economics, White Papers