SAF in the IRA Era – How do the incentives stack up?
Link to article: https://stillwaterassociates.com/saf-in-the-ira-era-how-do-the-incentives-stack-up/
April 13, 2023
The Inflation Reduction Act of 2022 (IRA) provides for a two-phased approach to incentivize sustainable aviation fuel (SAF) production. The first phase, 2023-2024, expands the biomass-based diesel blenders tax credit (BTC) to include a separate per-gallon incentive for SAF. In the second two-year phase, 2025-2027, the tax credit is enhanced so that renewable fuels including SAF will be eligible for the clean fuel production credit (CFPC). We detailed the structure of each incentive in our article Inflation Reduction Act Sustainable Aviation Fuel Credit. Until the IRA passed, renewable diesel (RD) production was incentivized over SAF production due to RD’s higher energy density. Most volumes of both fuels have been directed to the California market, drawn by financial incentives available under the state’s strong Low Carbon Fuel Standard (LCFS) program. In this article, we’ll examine how the value of SAF is changing given new incentives and whether greater SAF volumes will begin to flow beyond California’s borders.
Why is SAF production uneconomic now?
The airline industry has set a target of net-zero carbon emissions by 2050 (1) with SAF playing a crucial role in achieving this goal, and the Biden administration has set a goal of producing 3 billion gallons of SAF in the U.S. by 2030. According to Renewable Fuel Standard (RFS) data, in 2022 total SAF supplied to the U.S. was 15.8 million gallons (mg) (1 thousand barrels per day, kbd) with most of that volume going to California.(2) That’s up from 5 mg total (0.3 kbd) in 2021, but still just a drop in the bucket for the goals set out by the airline industry and the Biden administration. For perspective, according to the U.S. Energy Information Administration, total U.S. jet fuel supplied in 2021 was 21,002 mg (1,370 kbd). California’s share was about 14% of that at 2,959 mg (193 kbd). Accordingly, 2021 SAF volumes made up 0.3% of total U.S. supply and 2% of California supply.
With all the expressed interest in SAF and new incentives for SAF production, why is so little currently available? Right now, the SAF on the market is a byproduct of the hydroprocessed esters and fatty acids (HEFA) process used to make RD. In the HEFA process, in which renewable fats, oils, and greases are used to produce fuel, RD is the most economic fuel to produce. To produce more SAF, producers must accept some refining and commercial trade-offs. We discuss the trade-offs for increasing SAF production in detail in The Social Cost of Carbon Part 3: What Does it Cost To Reduce Carbon in California’s Jet Pool. To summarize: RD facilities which also produce SAF require additional capital costs to fractionate the jet from the diesel cuts. If the facility is designed to maximize jet fuel yield, the total yield of the most valuable products (jet and diesel) declines. This makes the whole product mix less valuable to the producer.(3)
But the HEFA process is not the only way to produce SAF. With stiff competition for renewable fats, oils, and greases feedstocks, technologies that use alternative feedstocks like alcohol-to-jet fuel (ATJ) and waste-to-SAF processes using Fischer Tropsch (FT) technology may be able to create an advantage if they can achieve commercial scale. ATJ companies like LanzaJet and waste-to-SAF companies like Fulcrum Bioenergy are working to develop these alternatives.
A final hurdle for SAF is the regulatory environment which has created a higher value for RD than for SAF because of RD’s higher energy density. The federal RFS; state low carbon fuel (LCF) programs like those in California, Oregon, and Washington; and Cap & Trade programs like those in California and Washington add costs to the petroleum diesel fuel but not to petroleum jet fuel. Since RD is worth roughly petroleum diesel value in the retail market, adding to the costs of petroleum diesel increases the value of RD.
How do the incentives stack up?
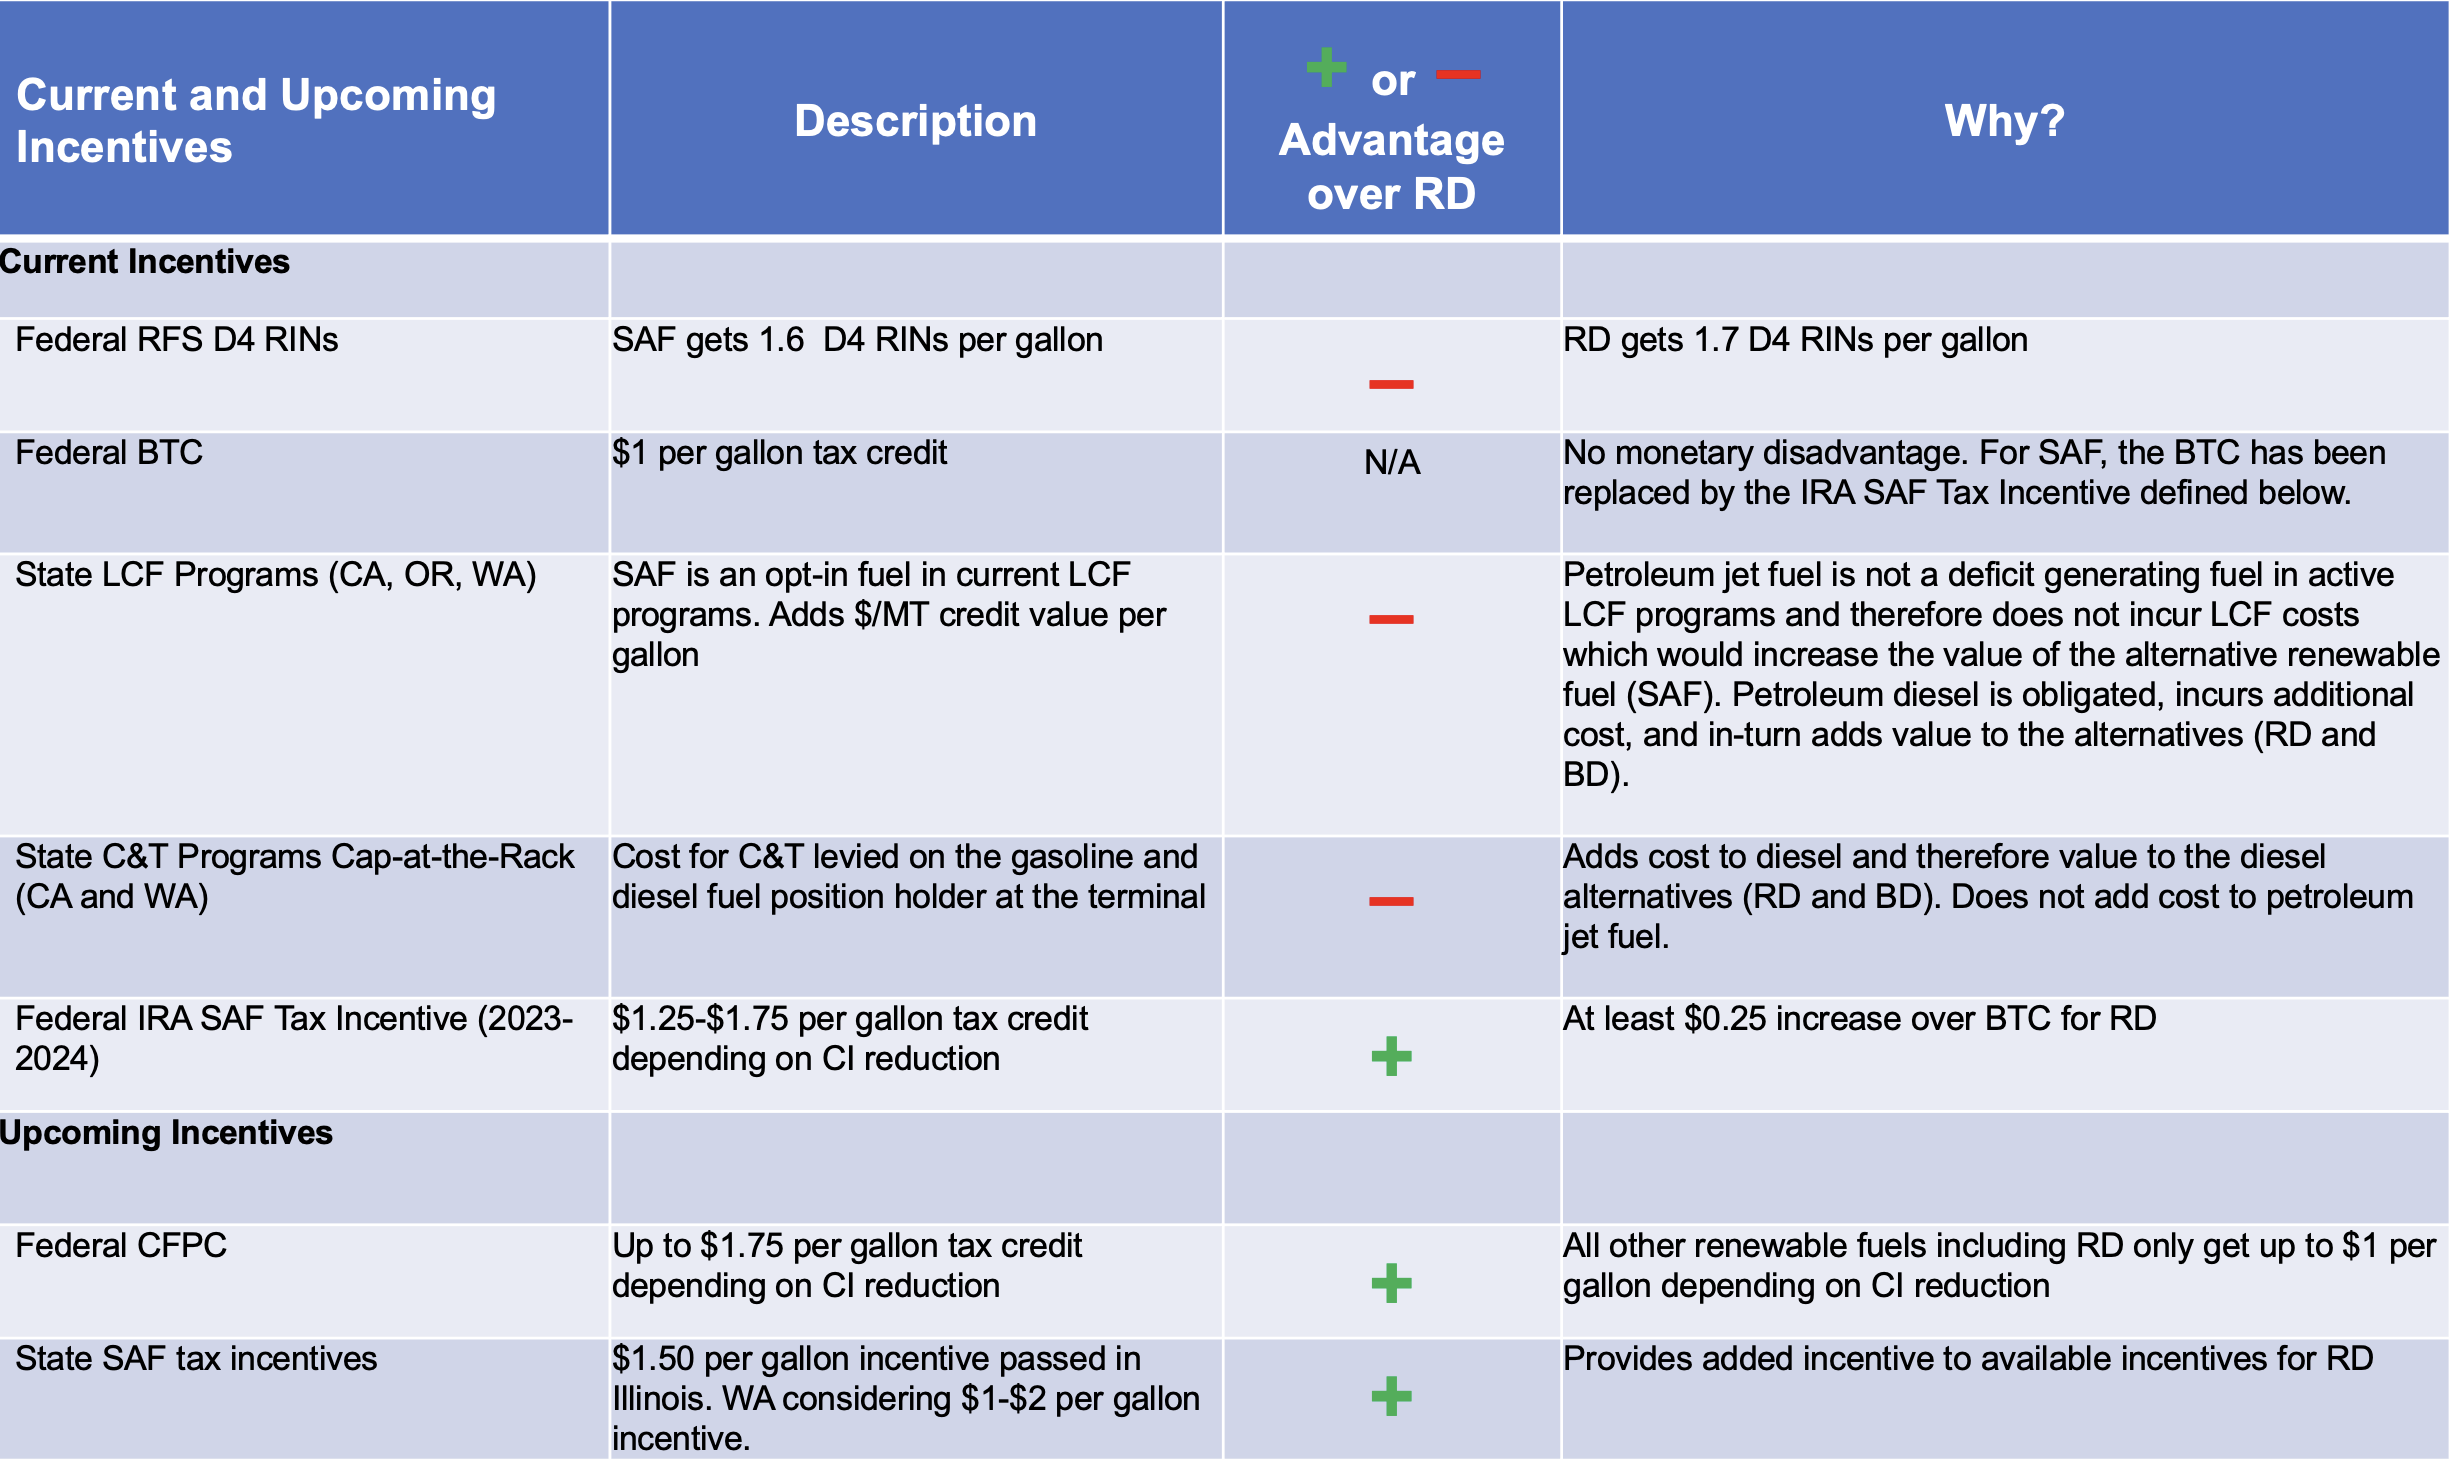
Like all renewable fuels in the U.S., SAF gains the most value when it benefits from the full incentive stack including federal and state incentives. The table below details the advantages and disadvantages for SAF in the current and upcoming incentive stack.

In addition to the current federal and state programs, new state incentives outlined in the table above are on the horizon. Illinois passed a $1.50 per gallon tax incentive which airlines operating in the state can claim for fuel purchased in Illinois. The Illinois SAF tax credit is available for fuel that achieves at least 50% lifecycle GHG reduction when compared to petroleum jet fuel. The incentive is effective for ten years – from June 1, 2023 through June 1, 2033. By 2028, all fuel must be derived from domestic biomass resources. It should be noted that Illinois passed a SAF tax incentive even in the absence of a state LCF program, which is currently under legislative consideration.
Washington state is considering adding a per-gallon SAF tax incentive on top of their current active roster of greenhouse gas (GHG) reduction regulations, the Clean Fuels Standard and Cap & Invest Program. The proposed Washington incentive is similar to the IRA SAF Tax Incentive, requiring a 50% carbon intensity (CI) reduction from petroleum jet fuel. Qualifying fuel will receive $1 per gallon plus $0.02 for each additional 1% reduction beyond 50%, capped at $2.
Will these incentives increase competition between RD and SAF?
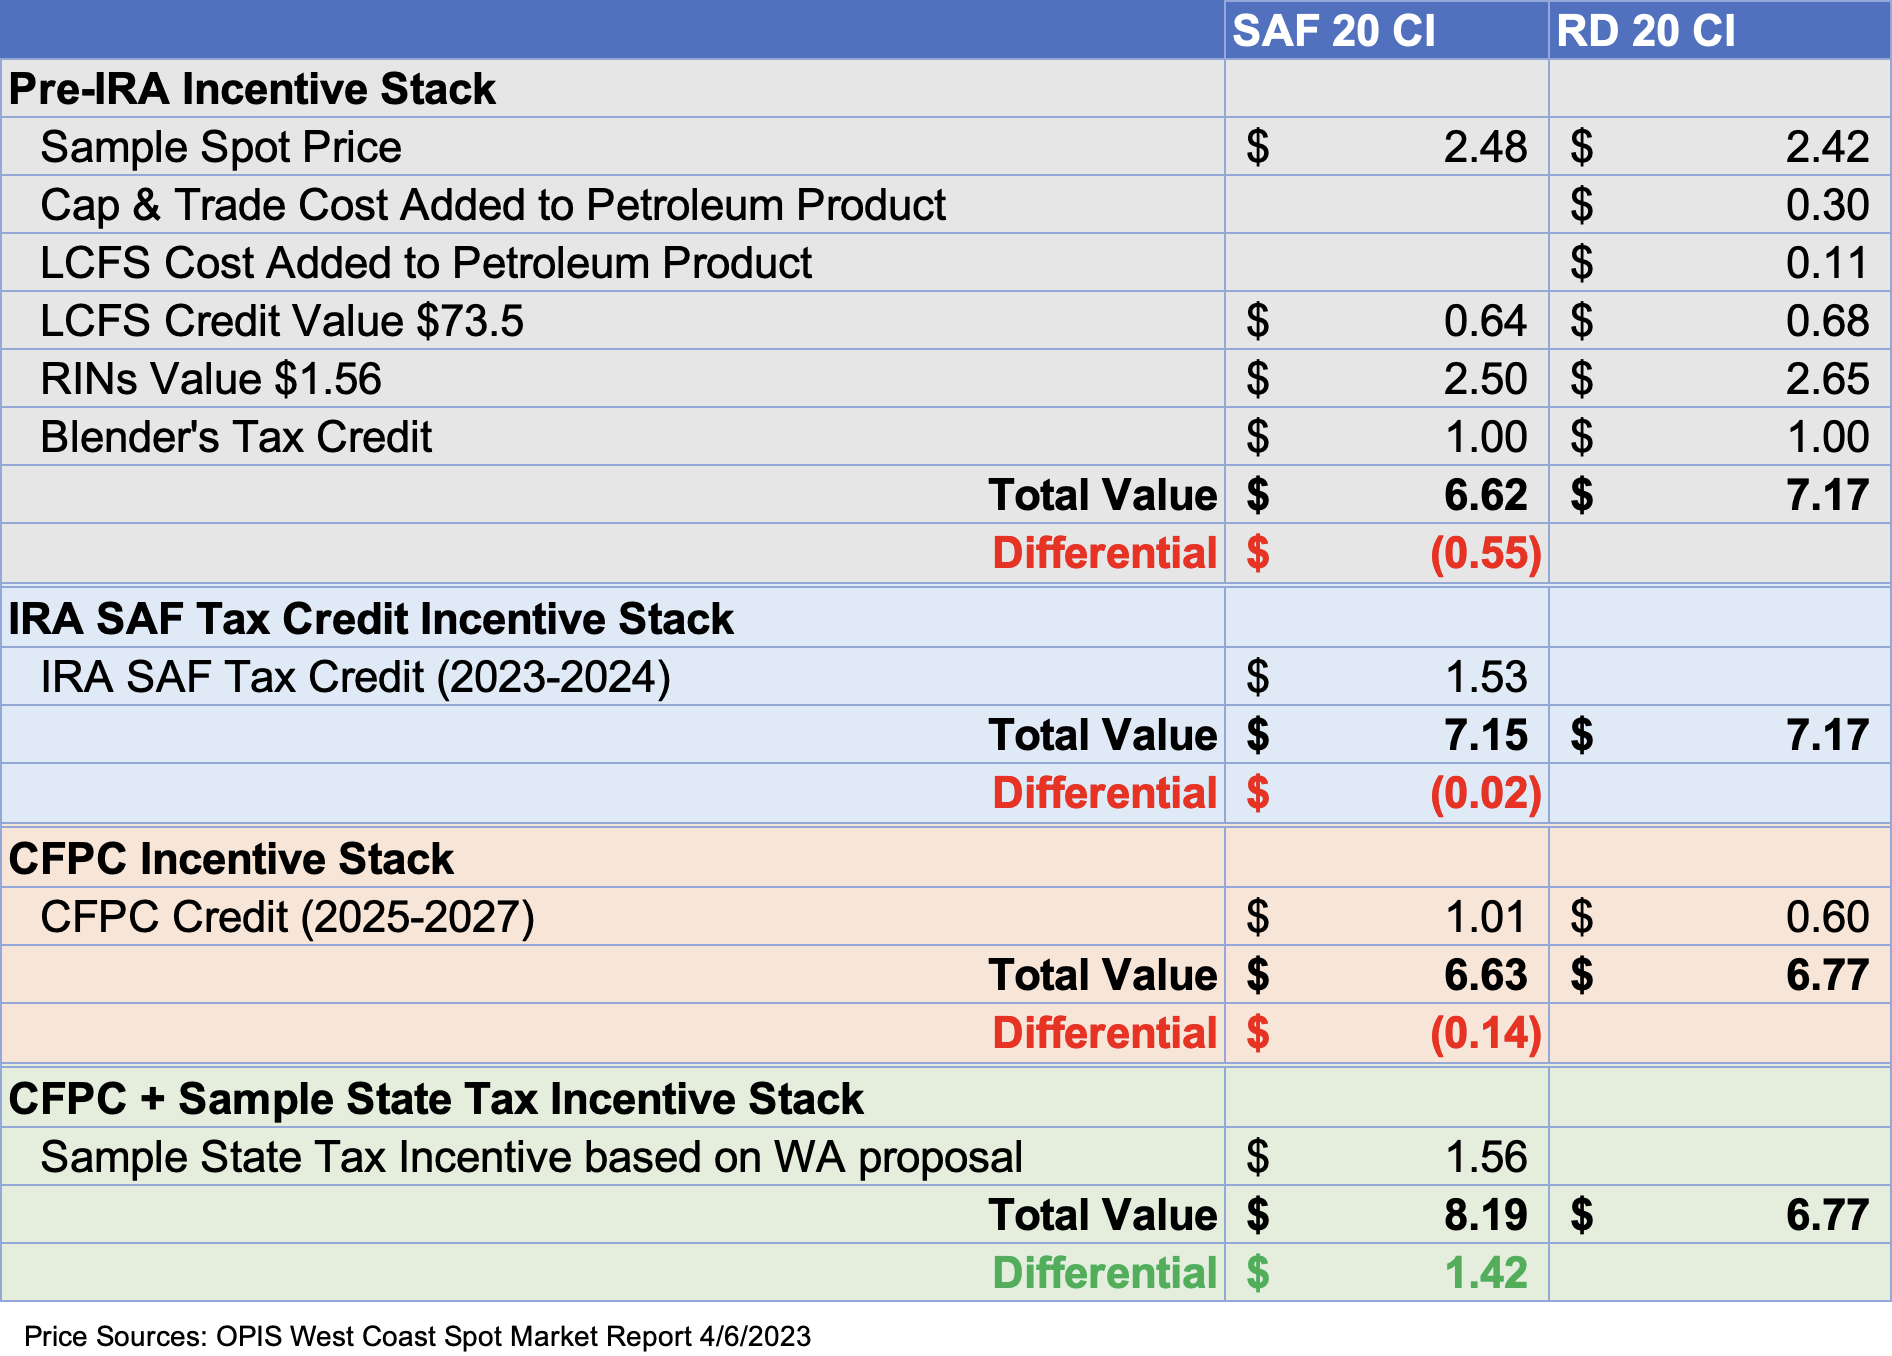
For SAF to be competitive with RD, the value of the SAF incentive stack will have to be at parity with or an improvement over the RD value. SAF and RD producers will prioritize markets that offer the most value for their product(s). In the current regulatory environment, and depending on logistics costs, those markets are on the West Coast where LCF and Cap & Trade (C&T) programs are in place. For this analysis, we use California wholesale spot price, LCFS credit prices, and C&T values to illustrate the full value of the SAF and RD incentive stacks. The table below shows a sample differential between the SAF and RD incentive stacks for each two-year phase of the IRA using fuels with a CI score of 20 grams of carbon dioxide equivalent per megajoule (gCO2e/MJ or simply g/MJ).

You can find the calculation for the IRA SAF Tax Credit in our previous article Inflation Reduction Act Sustainable Aviation Fuel Credit. Stillwater’s calculation for the CFPC value can be found in So Long BTC, Hello CFPC. Please note that the calculation for the CFPC value is Stillwater’s estimate based on information contained in the IRA. Until the Internal Revenue Service (IRS) publishes regulations and guidance on how they will implement the CFPC, it is not possible to provide an exact calculation for the CFPC value. The formula for the sample state tax incentive based on the Washington state proposal is similar to the formula for the IRA SAF Tax Credit with an additional $0.02 per percentage point above a 50% reduction, rather than the $0.01 defined in the IRA. The proposed Washington incentive was used in this calculation, rather than the Illinois incentive, because Washington has comparable LCF and C&T programs to California.
While spot prices and credit values will vary depending on market location and fuel CI, the table above offers a simplified view of the SAF/RD differential as the IRA and state incentives evolve. As can be seen, based on the sample spot price and credit values, RD enjoyed a healthy premium to SAF before the IRA was signed. With the introduction of the IRA SAF Tax Credit this year, the incentive stacks are close to parity, with RD having a slight advantage. When the CFPC is introduced in 2025, the calculation shows RD’s advantage growing slightly. If an additional state tax incentive is added to the stack, like the one proposed by Washington state, SAF sees a healthy premium over RD. Note that the Illinois SAF Tax Incentive will create a $1.50 premium for SAF over RD in the state, unless or until they pass an LCF program which will add value to RD that isn’t currently available in that market.
The provisions in the IRA give SAF a fighting chance in the competition with RD. The incentive value at parity with or an improvement over RD will also provide market signals to boost alternative SAF technology like ATJ and FT processes, which may also broaden the options for renewable feedstocks beyond the tight fats, oils, and greases feedstock market. Importantly, while California offers the highest value for both fuels now, the introduction of state SAF tax incentives could create alternative markets for a highly sought after product.
(1) Airlines are extremely price sensitive because their customers are price sensitive. Any increase in cost pass through to ticket price will cost the airlines in seat mile revenue.
(2) Correction: This article originally stated 2022 total SAF supplied was 185.6 mg (12.4 kbd) and 2021 total SAF supplied was 60 mg (3.9 kbd). This was a calculation error. We regret any confusion.
(3) It should be noted that Montana Renewables recently announced that their HEFA process, using the latest technology from Haldor Topsoe, “has the capability to offer SAF at price parity” with RD.

