Projecting the Costs of California’s Cap & Trade and Low Carbon Fuel Standard Programs
Link to article: https://stillwaterassociates.com/projecting-the-costs-of-californias-cap-trade-and-low-carbon-fuel-standard-programs/
July 25, 2018
By Jim Mladenik and Kendra Seymour
Showing the line-item cost to consumers of carbon-reduction programs assists legislators in crafting effective policy and helps fuel consumers make informed decisions. To that end, Stillwater’s carbon policy team recently conducted an analysis of the potential impact of California’s Low Carbon Fuel Standard (LCFS) and Carbon Cap & Trade (C&T) programs on consumer fuel prices, assuming the range of credit prices being discussed by stakeholders. We assumed the fuels to be E10 (10% ethanol in the gasoline pool) and B13 (13% biodiesel and renewable diesel in the diesel pool), consistent with the fuels mix in California last year.
Cap and Trade Program Costs
For California’s Cap and Trade program, we estimated the total direct costs to refiners and assumed that these costs are entirely passed through to consumers. Competition in the marketplace may prevent complete cost pass through, but for the purposes of this analysis, 100% cost past through is assumed. There are two components to our cost estimation:
- Costs attributed to allowances required to be purchased for the greenhouse gases (GHG) emitted from the combustion of fuel (“Fuels under the Cap” or “Cap at the Rack”)
- Costs to purchase allowances for GHG emissions in the production of fuels (“Stationary Source Cap and Trade”)
Cap at the Rack is calculated directly from factors published in the Mandatory GHG Reporting Regulation. Currently, “Cap at the Rack” adds about 13 and 14 cents per gallon (cpg) to the cost of gasoline and diesel, respectively, at the current allowance price of $15 per metric ton.
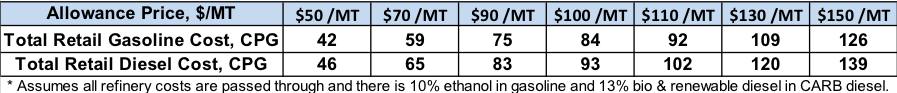
The cost of Stationary Source Cap and Trade is estimated using 2016 data on refinery emissions from the MRR and “Vintage 2016 Industrial Allowance Allocation by Sector” for petroleum refineries. It is assumed these costs are allocated across all of the gasoline and diesel sold in California. We calculated the cost added to the fuels for allowance prices varying from $50/MT to $150/MT because these represent the range of values being discussed for a price ceiling in the C&T program going forward. The results are summarized in Table 1 and show additional fuel costs ranging from 42 to 139 cents per gallon.
Table 1. Total Cost Added to Transport Fuels from Cap & Trade
LCFS Program Costs
The cost added to fuels from the LCFS will change every year due to changes in the LCFS credit price and to the increasingly stringent carbon intensity (CI) reductions that require more LCFS credits per volume of higher CI fuel. To estimate these prices going forward, we assumed two different sets of credit prices. The first and higher value is the “cap” on LCFS price for credits transacted in the end-of year Credit Clearance Market (CCM) which is required by regulation if any of the market participants has a net deficit total for a given year. The CCM cap is set at $200/MT in 2016 and is assumed to escalate with inflation by 3% per year. The second set of credit prices is the one published in CARB’s April 2018 Initial Statement of Reasons that estimates the increases in costs to the program from 2020 to 2030 with the proposed schedule of increasing CI reductions.
Prices assumed in our analysis average about $125/MT in 2016 dollars but were escalated assuming inflation of 3% per year so that they increase to about $200/MT by 2030. The CI reductions in the new proposal increase linearly from 7.5% in 2020 to 20% in 2030. The calculation results with these assumptions are summarized below in Table 2. In 2030, costs range from 47 to 71 cpg, and this compares to costs today of 8 cpg for diesel and 12 cpg for gasoline.
Table 2. Impact of LCFS Credit Price on Fuel Prices

Total Cost Added from LCFS and C&T in 2030
To assess the potential costs of these programs in the future, we combined the costs of these programs in 2030 using the range of C&T allowance prices and LCFS credit prices from the above analyses. The results are shown in Table 3 below. Total costs added to gasoline and diesel from the C&T and LCFS regulations are found to vary between 89 and 210 cents per gallon.
Table 3. Total Cost Added from LCFS and C&T in 2030

Want LCFS news, data, and exclusive expert analysis delivered to your e-mail inbox? Subscribe to our LCFS Newsletter.
Tags: C&T, Cap and Trade, LCFSCategories: Economics, Policy, Wisdom from the Downstream Wizard