Potential Impacts of LCFS-Style Programs on Fuels Markets
Link to article: https://stillwaterassociates.com/potential-impacts-of-lcfs-style-programs-on-fuels-markets/
February 15, 2021
Low Carbon Fuel Standard (LCFS) programs are structured to reduce the carbon intensity (CI) of transportation fuels over time by setting progressively stricter CI reduction standards each year. All fuels with CI values higher than the standard, such as petroleum gasoline and diesel, generate deficits. Fuels produced or imported with CIs lower than the standard, such as renewable diesel (RD) and other biofuels, generate credits.[1] Petroleum producers/marketers are required to offset the deficits generated by the gasoline and diesel they produce and/or sell by either buying or producing low-carbon fuels or by purchasing LCFS credits from another party. Renewable fuels producers/marketers benefit from the LCFS because the value of the credits generated increases the value of renewable products. An LCFS credit represents one metric ton (MT) of CO2 reduced, and the value of the credit is determined by market dynamics. In early 2021, the market price of LCFS credits in California is about $200 per MT, which, depending on market dynamics, would add about $0.24 per gallon to the consumer price of diesel and gasoline.[2] Since almost all gasoline is blended with 10% ethanol before it is sold to consumers, the actual added cost of the LCFS to finished gasoline at the pump may be slightly less – about $0.22 per gallon.
The Price of Renewable Diesel Relative to Petroleum Diesel
OPIS has reported sales of RD to consumers at prices below those reported for petroleum diesel. Some might think that this means RD is less expensive to produce than traditional diesel. The reality of this situation is, however, more complicated than that. RD is currently much more expensive to produce than petroleum diesel because RD manufacturing facilities are expensive to build and operate. Additionally, the feedstocks used to produce RD are typically more costly than the cost of finished wholesale diesel.[3] Because of regulatory drivers (from the LCFS and other climate change initiatives), however, RD has associated value that helps it price competitively with (and in some cases below) traditional diesel. Below, we explain how these economics play out.
For trucking companies, who are the most common RD consumers, the value of fuel is measured by the amount of energy it produces to move freight. Using the California LCFS values assigned to diesel and RD, the energy density of RD is 3.6% lower than diesel,[4] so its face-value to trucking companies would be 3.6% less than diesel. As such, if diesel sells for $2 per gallon, the price for RD – if priced strictly based on energy density value – would be discounted by about 7 cents per gallon (cpg). However, since there is a range of energy density values for diesel in the market depending upon how the final product is blended, RD will often price very close to diesel value. In fact, for some diesel consumers, the use of RD may provide reputational value associated with the use of low-CI fuel. This reputational value may offset the added expense of the lower energy density of RD. (Note that RD has very good combustion properties, so the difference in fuel efficiency in some trucks could be lower than 3.6%. Also note that according to the LCFS, biodiesel has 6.2% less energy than petroleum diesel, so sophisticated buyers of diesel blended with the typical 5% biodiesel (B5) should demand a lower price to fuel with this B5 blend than with 100% petroleum diesel.)
To understand the pricing of diesel and RD in an LCFS market requires an appreciation of the components of value for these fuels and how they are traded in the fuel value chain. Petroleum diesel’s single component of value in the market is its energy content for use in diesel engines. RD is similarly valued for its energy content but has an additional component of value through the reputational boost described above and RD’s ability to produce credits for an LCFS program. As mentioned above, in 2021 the California LCFS program appears to add about $0.24 to the cost of a gallon of petroleum diesel, but it also adds $1.30 of value from the credits generated to each gallon of RD.[5] These credits are a value component because they can be sold to the petroleum diesel producer/marketer who needs them to demonstrate compliance with the LCFS. Given that the LCFS adds $0.24 per gallon to the cost of diesel and also increases the value of RD by $1.30 per gallon, the net pricing advantage created by the LCFS for an RD producer would be about $1.54 per gallon.
Other regulations, such as the federal biomass-based diesel blender’s tax credit (BTC) and Renewable Fuel Standard (RFS), also generate added value for RD. While RD producers typically capture most of this value, some of the value is shared throughout the fuel value chain. As with the LCFS, production of RD generates RFS credits which can be sold to refiner/marketers of petroleum diesel. RFS credits (known as renewable identification numbers, or RINs) are submitted to the U.S. Environmental Protection Agency (EPA) to demonstrate compliance with the RFS. Like the LCFS program, the RFS adds costs to diesel and value to RD. Currently, the cost of purchasing RINs adds about $0.10 per gallon to the cost of diesel in the U.S. The value of the RINs generated by RD adds about $1.87 per gallon to the value of RD. The federal biomass-based diesel BTC adds an additional $1.00 per gallon of value to RD that likely does not directly impact fuel consumers.[6] Instead, it reduces the federal tax bill for biodiesel (BD) or RD blenders, which increases RD value in the supply chain. This additional value is therefore paid for by all U.S. taxpayers.
Table 1 below summarizes the components of value for RD and CARB diesel (the grade of diesel required in California) and tallies the total value of each. As shown, the regulations outlined above (when combined) would, depending on market dynamics, add about $4.32 of value per gallon of RD while simultaneously adding about $0.33 of cost per gallon of CARB diesel. The result is a projected, effective net pricing advantage to an RD producer from all three incentives (LCFS, BTC, and RFS) of $4.65 per gallon ignoring the impact of energy density.
Table 1. Los Angeles Fuel Values (February 10, 2021)
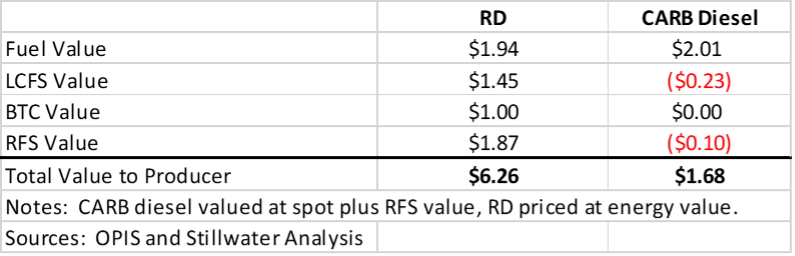
As mentioned above, RD producers retain most but not all of the value of LCFS credits, RINs, or the BTC. Some of the value of these incentives is shared with participants in the fuel value chain. Producers can retain most of this value if they transport the fuel to California and obtain logistics facilities to store, blend, and load the products into trucks to sell directly to customers, but doing so adds significant cost and effort.
Who May Pay the Additional Costs of Renewable Fuels?
The fact that RD is sometimes priced lower than petroleum diesel might seem to suggest that the higher production costs associated with RD are not paid for by consumers. However, someone must pay for these costs. As explained above, under an LCFS program, fuels with a higher CI than that year’s standard generate deficits and fuels with a lower CI than the standard generate credits. This creates value for the lower carbon fuels and adds costs to the higher carbon fuels. Through these mechanisms, but subject to free market dynamics such as supply and demand, both the LCFS and the RFS may transfer higher production costs of RD to the producers/importers of gasoline and diesel in the U.S. who, in turn, also subject to market dynamics, may pass these along to consumers of these products. It is clear that these programs add significant costs to transportation fuels.
LCFS costs are likely to be paid by Californians who fuel up with traditional gasoline and diesel, and the costs of the RFS and the BTC are likely paid by U.S. gasoline and diesel consumers and U.S. taxpayers, respectively. (See more on this in a recent Stillwater Associates analysis.) Table 1 above shows that the cost of the LCFS and RFS which if passed through, would add 33 cpg to the cost of diesel in California, while adding $3.32 per gallon of value to RD. In other words, the LCFS and RFS programs have the potential for transferring the additional costs of producing biofuels to petroleum products producers and their customers.
How Much Have Regulations and Fees Added to the Cost of Fuels in California?
Figure 1 below shows the overall increase in taxes and fees added to the cost of gasoline in California over the past ten years. As can be seen, the federal excise tax has remained unchanged, and sales tax has changed very little since the end of 2010. California excise taxes declined in 2016 and 2017 but are now about 15 cpg higher than in 2011. These taxes are charged at the pump and are automatically collected in the cost of fuels. However, the two largest components of cost increases shown in Table 1, those from the LCFS and the state’s Carbon Cap and Trade Program (C&T), are added before the fuel reaches the pump and are therefore subject to competitive forces that might impact the ability to be passed through to consumers. LCFS costs have increased from zero in 2011 to about 24 cpg in 2021. Similarly, the costs added to gasoline by the C&T program known as Fuels Under the Cap (FUC) have increased from zero to about 14 cpg over the same time frame.
Figure 1. Trends for Total Taxes and Fees on California Gasoline
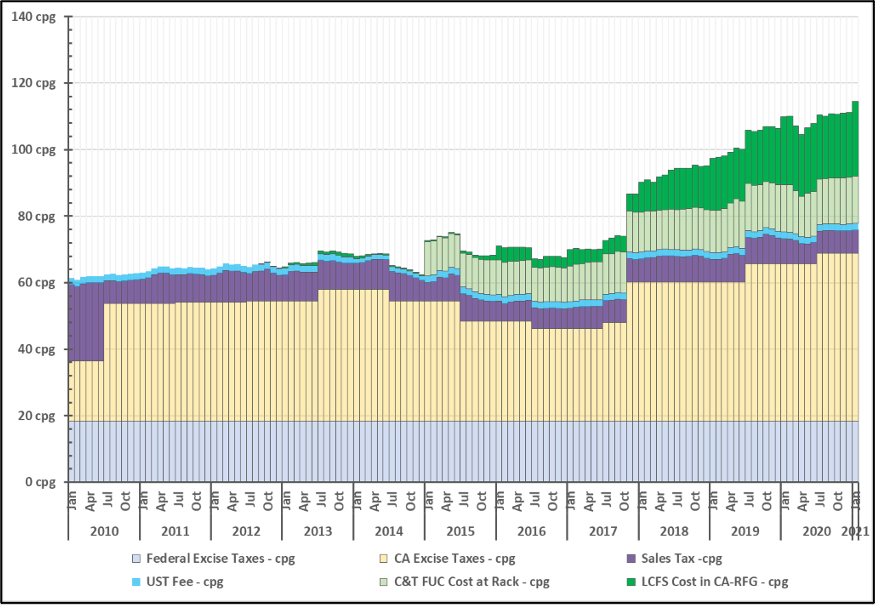
Notice that the LCFS had no significant cost impact until 2015, and that the C&T added more costs to gasoline than the LCFS until the end of 2018 when LCFS costs increased to levels that exceed the impacts of C&T.
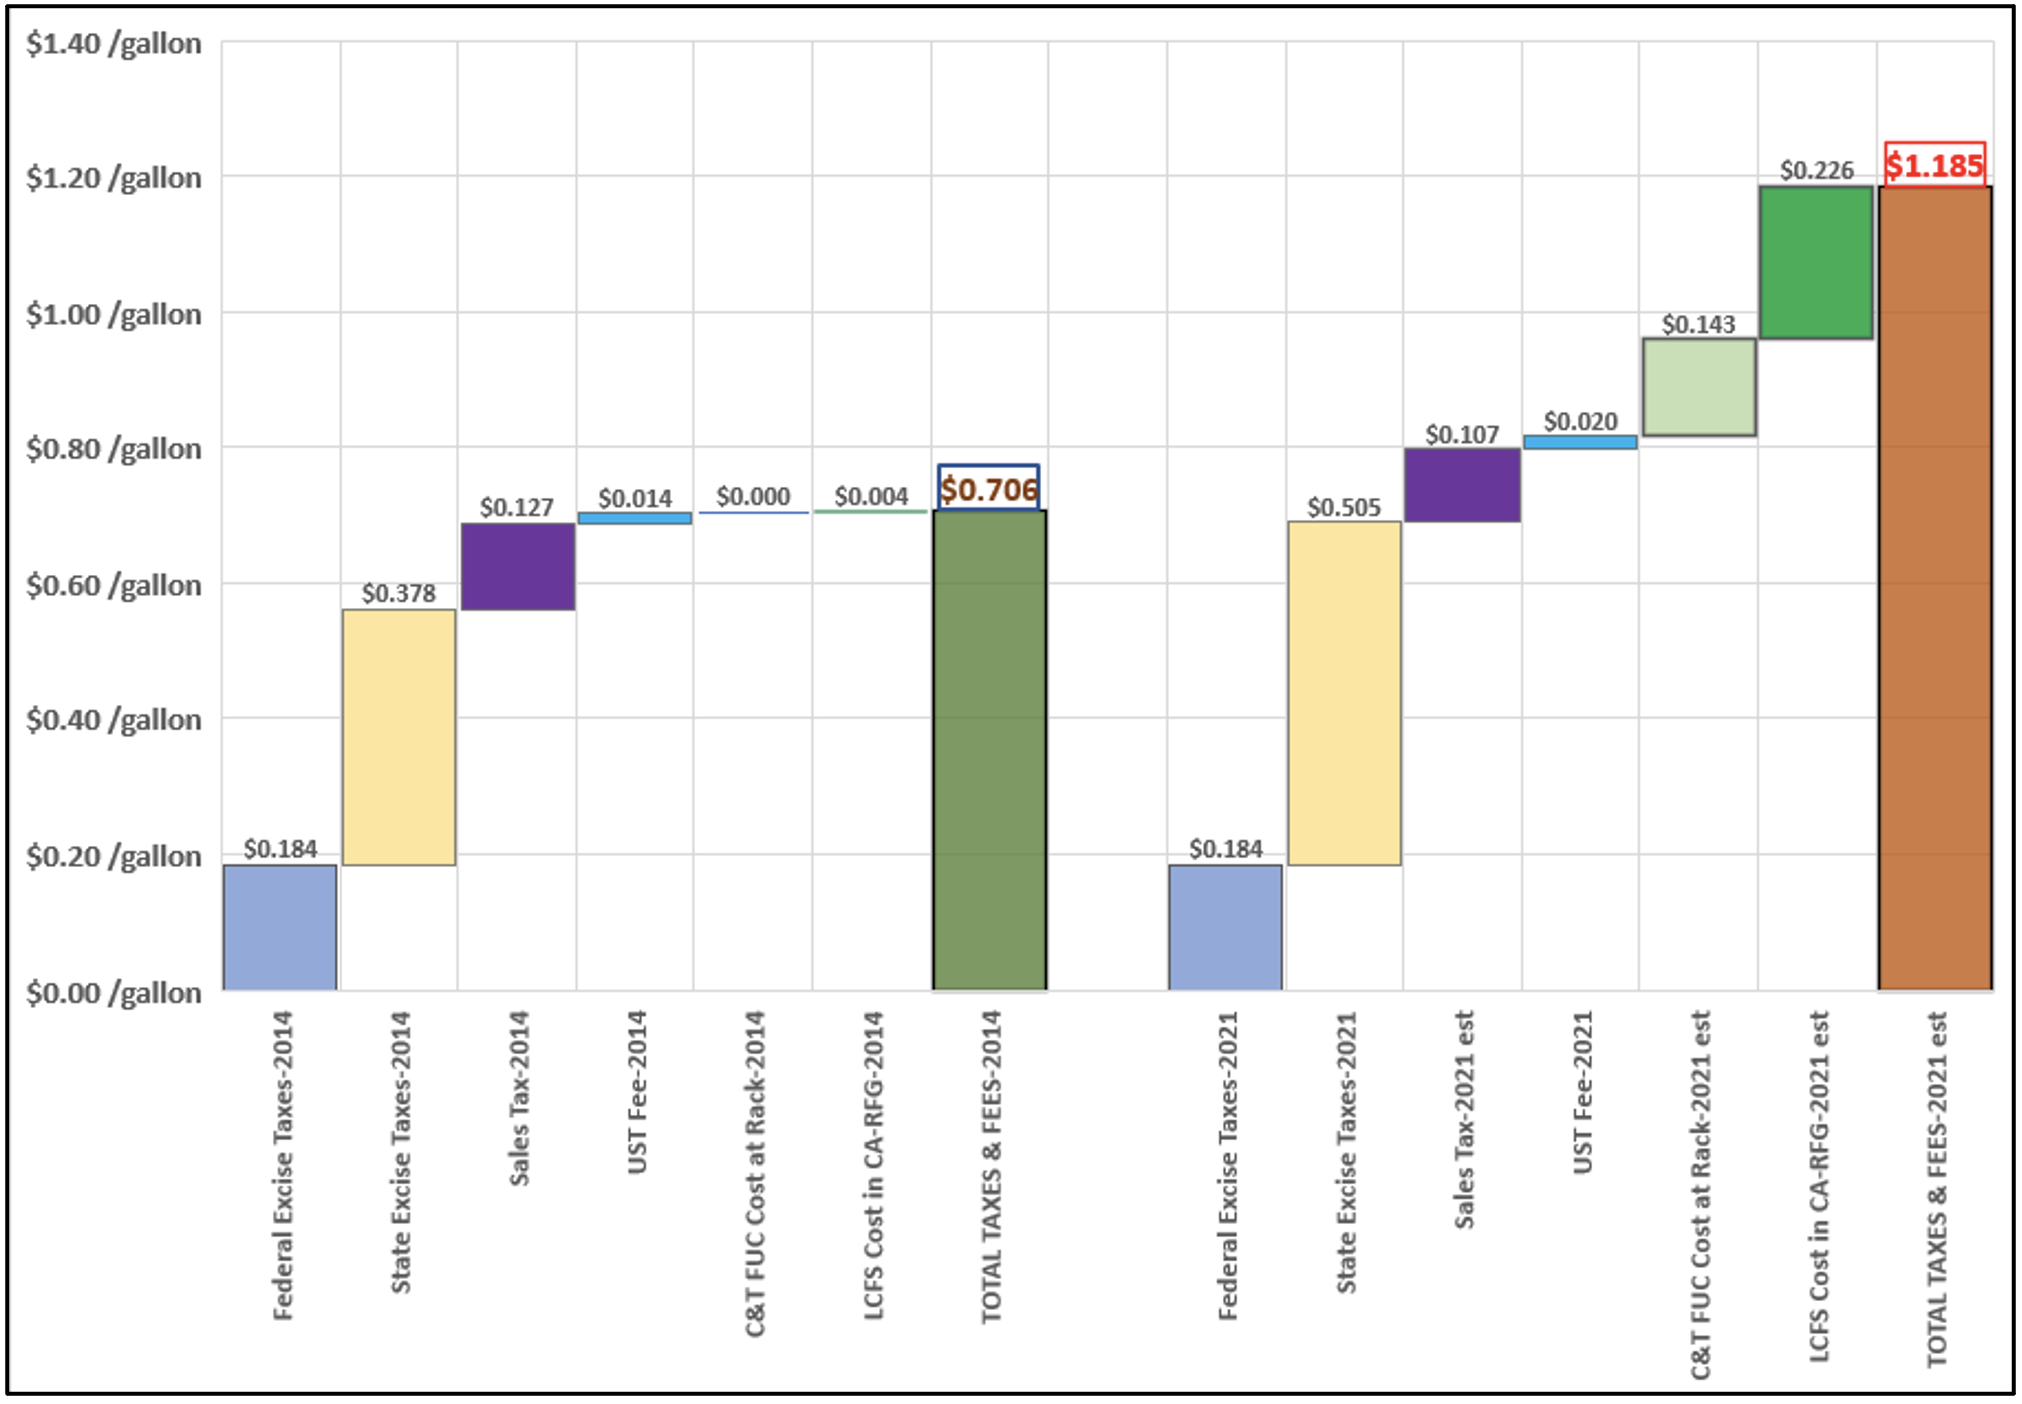
Figure 2 below shows a closer look at the taxes and fees in two specific years – 2014 and 2021. As can be seen, the state excise taxes, C&T, and LCFS increased by $0.127, $0.143, and $0.222 per gallon, respectively. These three taxes and fees have caused an increase of over $0.49 per gallon in the cost of California gasoline over those six years.
Figure 2. 2014 and 2021 Breakdown of Total Taxes and Fees on California Gasoline
If the LCFS and RFS Are Adding Costs to Fuels, Why Have Gasoline Prices Declined Since the Regulations Were Adopted?
Given the costs added to gasoline from taxes, fees, and regulations such as the LCFS and RFS, one might assume that this increase in taxes and fees would raise the retail price of gasoline over the same period of time. In fact, the retail price of gasoline to consumers in California has not increased since implementation of the LCFS ten years ago, leading some to suggest that the LCFS has not added to the cost of fuel. This is an oversimplification, however, as there are many components that make up the total cost to the consumer, including crude oil, refining, terminals, transporting the fuels, retail, taxes, fees, regulatory costs, and supply and demand along with other market factors. The EIA, CEC and others have detailed the factors that determine gasoline price, which primarily is comprised of four main components:
- The cost of crude oil
- Refining costs and profits
- Distribution and marketing costs and profits
- Taxes and fees
These four components account for recent gasoline prices nationally as shown in Figure 3 below.
Figure 3. Primary Components Impacting the Price of Gasoline and Diesel
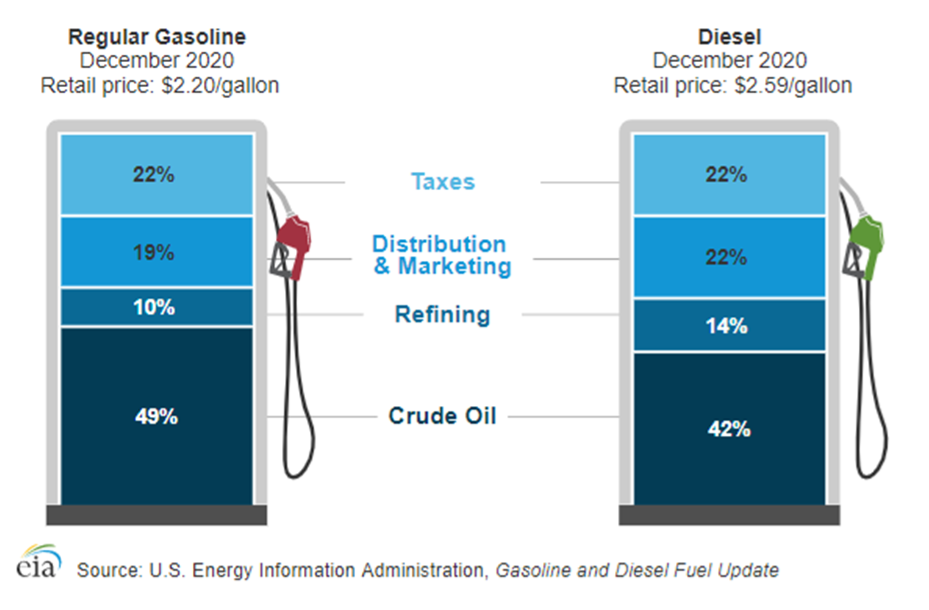
As can be seen in the figure above, crude oil makes up the single largest portion of the cost of a gallon of gasoline or diesel. One of the crude oils most commonly used to produce California-grade gasoline and diesel over that past ten years has been produced on the Alaskan North Slope (ANS). The price history of ANS crude oil over the past ten years is shown in Figure 4 below.
Figure 4. Alaskan North Slope Crude Oil Price History
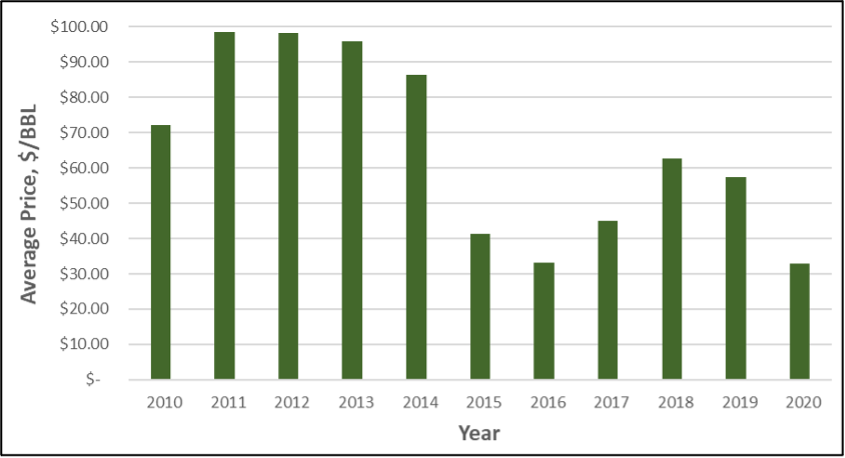
ANS averaged over $90 per barrel during the early years of the LCFS, from 2011 to 2014. In the past four years, ANS has averaged less than $40 per barrel (down more than 50% from when the LCFS was implemented). This decline in the price of crude oil results in gasoline prices being reduced by more than $1.00 per gallon even as taxes and fees increase. Therefore, the reason that fuel prices to consumers have declined since the LCFS was implemented is that the largest component in determining fuel prices, the cost of crude oil, has declined so much over the past six or seven years that the resulting reduction in fuel prices is greater than the increased costs added by LCFS. Without the added costs of the LCFS and other taxes and fees (a pricing component which makes up more than 20% of the price of a gallon of fuel, as shown in Figure 3), California gasoline and diesel prices would likely be lower still.
Summary
The progressively stricter CI-reduction targets of the LCFS drives producers and marketers to increasingly incorporate the use of low-carbon fuels. Through the mechanism of deficits and credits, the cost of incorporating low-CI fuels is transferred from renewable fuels and added to petroleum fuels such as gasoline and diesel to the extent that the market will allow, causing the price of petroleum fuels to rise and the price of fuels such as RD to decline. Ultimately, most of the added costs of the LCFS, RFS, and BTC associated with renewable fuels subject to free market factors, are passed on to consumers and taxpayers.
California taxes and fees assessed at the pump have increased by nearly 48 cents since 2014 (shortly after the LCFS was implemented), but the price of retail gasoline and diesel in California has declined since the implementation of the LCFS program. This decline in fuel price is not because of the LCFS program but in spite of it. An unrelated decline in the price of the crude oil used to produce California-grade gasoline and diesel along with demand reduction, partially caused by the Pandemic, helps explain the decline in retail gasoline and diesel prices, but those prices would likely be lower still without an LCFS program in place.
[1] https://ww2.arb.ca.gov/our-work/programs/low-carbon-fuel-standard/lcfs-regulation
[2] Source: OPIS
[3] Using data from the U.S. Department of Agriculture (https://www.ams.usda.gov/mnreports/nw_ls442.txt), the cost of feedstocks such as yellow grease and inedible tallow are roughly $2.50 to $3.50 per gallon, or about double the cost of diesel fuel.
[4] Based on energy values stated in the LCFS regulation https://ww2.arb.ca.gov/our-work/programs/low-carbon-fuel-standard/lcfs-regulation.
[5] OPIS and Stillwater Analysis
[6] OPIS reported prices on 2-10-21 and Stillwater Analysis

Get expert insights on LCFS, CFP, BC-LCFS, and RFS credit prices.
Stillwater’s Carbon Market Outlooks help fuels producers and investors cut through the noise, navigate carbon market uncertainty, and plan for the future.
Preview a sample report