LCFS 101 – An Update
Link to article: https://stillwaterassociates.com/lcfs-101-an-update/
May 2, 2018
by Megan Boutwell
A lot has happened since we wrote our first LCFS 101 article last year. Here we provide an update on the rules and the status of the credit market.
What is the LCFS
California’s Low Carbon Fuel Standard is one of a group of programs designed to reduce greenhouse gas (GHG) emissions enacted through AB 32, the 2006 Global Warming Solutions Act, signed into law by Governor Arnold Schwarzenegger. The LCFS program was originally adopted in 2009 and became effective in 2011. It is administered by the California Air Resources Board (CARB).
The LCFS applies to fuels used for transportation, including gasoline and diesel and their alternatives. The goal of the program is to reduce the carbon intensity (CI) of the transportation fuel pool. The CI reduction schedule adopted in 2009 was, however, stayed by the California Appellate Court at 2013 levels due to deficiencies in the original LCFS adoption process. In 2015, CARB re-adopted a revised LCFS to remedy the deficiencies and update the program’s provisions. The re-adopted LCFS, with a revised CI reduction schedule, became effective on January 1, 2016, targeting the same 10% goal in 2020 as the original program.
On March 6, 2018, CARB released its Proposed Amendments to the Low Carbon Fuel Standard. Included in these proposed amendments are near-term changes in percent reductions of CI from 2010 levels. Instead of the originally proposed 7.5% reduction in 2019 and a 10% reduction in 2020, CARB is proposing a less ambitious 6.25% reduction in 2019 and 7.5% reduction in 2020. These proposed changes reach the original LCFS reduction goal of 10% in 2022 instead of the original target year of 2020. In the longer-term, CARB proposes a more ambitious 20% reduction goal in 2030 instead of 18% suggested in prior documents. CARB’s proposed amendments were considered at its April 27, 2018 board meeting. They are planned to be voted on at a second hearing in mid-to-late 2018.
Calculating Carbon Intensity (CI)
CI is defined as the lifecycle GHG emissions for a fuel per unit of transportation energy delivered. The CI of a fuel is calculated by assessing the GHG emissions in the lifecycle or “pathway” of the fuel. The pathway is determined by assessing the GHG emissions throughout each stage of the fuel’s feedstock production, conversion, and use. CI is calculated using the GREET model (Greenhouse Gases, Regulated Emissions, and Energy Use in Transportation) developed by the Argonne National Lab. In determining CI, the direct carbon emissions from renewable sources are not included in the calculation. To understand this, tailpipe carbon or carbon emitted from anywhere along the lifecycle is not counted towards the CI if it is from a renewable source. If the tailpipe carbon or carbon emitted from anywhere along the lifecycle is from a fossil source, it is counted towards the CI. CI is expressed in grams of CO2 equivalent per megajoule (gCO2e/MJ or g/MJ for short).
How does the LCFS work?
Fuels in the California transportation fuel pool that have a CI lower than the target established by CARB generate LCFS credits. Fuels in the transportation fuel pool with CIs higher than the target generate deficits. A fuel producer with deficits must generate or acquire enough credits to be in annual compliance with the standard.
Petroleum importers, refiners, and wholesalers are Regulated Parties (RPs) under the LCFS. CARB-approved alternative fuels producers can opt into the program; these participants are also referred to as RPs. When transportation fuels are imported, refined, or sold in California, RPs and opt-in RPs enter the transaction-level information into CARB’s central data system for the standard – the LCFS Reporting Tool (LRT). The LRT tracks each transaction of fuel with its corresponding credit or deficit position, and sums for each RP. Credits are retired when used to cover deficits per annual compliance report. LCFS credits do not have a vintage and do not expire. Credit transactions are reported to the LRT, including the transaction price in units of metric tons (MT) of LCFS credits. Credit owners can only sell or trade their credits with other RP deficit holders. Parties outside the 274 RPs are not allowed to hold LCFS credits.
In addition to credit generating fuels, the LCFS has provisions to generate credits through approved non-fuel activities. Among these are: innovative crude – crude oil produced using methods like solar-generated electricity, Refinery Investment Credits, Renewable hydrogen used in refining, and Carbon Capture and Sequestration (CCS).
What kind of fuels generate credits?
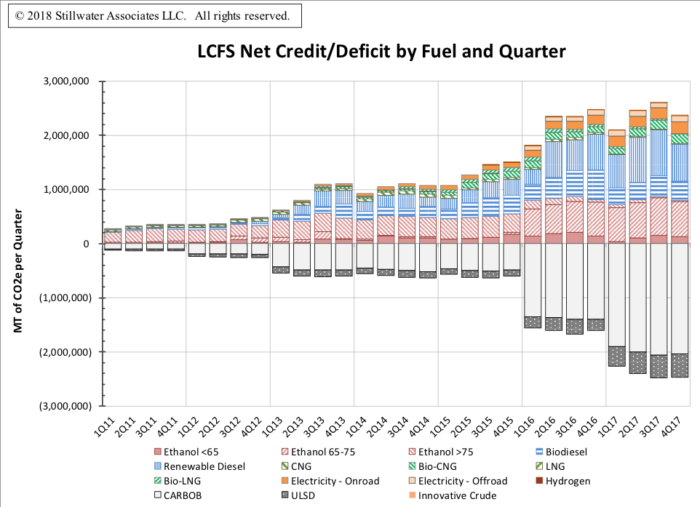
The low-CI fuels generating credits include ethanol, biodiesel, renewable diesel, compressed natural gas and biogas (CNG), liquefied natural gas and biogas (LNG), hydrogen, and electricity for electric vehicles (EVs) and other electric driven transportation. Currently, ethanol is the greatest single contributor to the alternative transportation fuel pool. However, because almost all gasoline in California is limited to a 10% ethanol/gasoline blend there’s a constraint to how much ethanol can contribute to the overall transportation fuel pool. This is known as the ethanol blendwall. Flex fuel vehicles (FFVs) can run on up to 85% ethanol, but the demand for higher blends of ethanol hasn’t materialized, and CARB has not encouraged the use of E85.
The combined credit contribution of biodiesel (BD) and renewable diesel (RD) make up the next largest contributor to the alternative transportation fuel pool. This category is helping to drive the success of the LCFS while other alternative fuels take time to develop technology and markets. The combined contribution of BD and RD has increased throughout the program. In Q4 2017, BD and RD made up a combined 42% of the total. The use of BD is hampered by blending limits with conventional diesel, infrastructure constraints, and high feedstock prices. RD*, however, shows a lot of promise because as a “drop-in” fuel it can replace conventional diesel without any infrastructure changes.
As the program progresses, Stillwater expects to see increased contributions from CNG and LNG, as CNG/LNG derived from biogas displaces fossil natural gas and as very low CI biogas displaces higher CI biogas. Credits from electricity for EVs are expected to increase appreciably as more than half of all EVs sold in the U.S. are in California, and the state has multiple programs to incentivize EVs and EV infrastructure.
The fuel with the tiniest contribution to the pool is hydrogen. We don’t expect hydrogen to make any big leaps although year to year growth rates may be high before 2020. Hydrogen vehicles are expensive and experimental, and the fueling infrastructure just isn’t available.
This year, CARB has proposed new pathways for credit generation including alternative jet fuel (AJF) and innovative actions at conventional fuel refineries, such as co-processing and Carbon Capture and Sequestration (CCS). These provisions will be considered in the next hearing in mid-to-late 2018.
How’s it going?
According to CARB, low carbon fuel use in California is increasing. That means renewable and alternative fuels are making inroads into displacing gasoline and diesel. The value of the LCFS credits generated in the past two years has reached $1 billion per year.
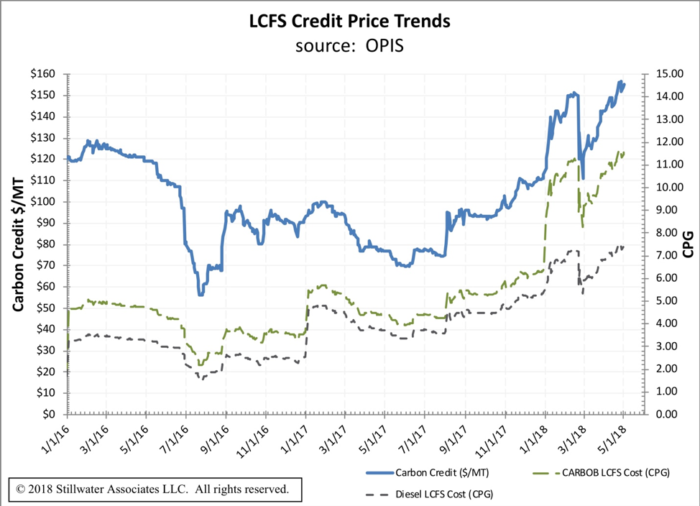
While credit prices had been relatively stable from the time the standard was implemented, except for a steep decline in prices starting in June 2016 through August 2016, they have climbed precipitously since August 2017. Based on our latest Weekly LCFS Newsletter, LCFS credits in 2018 are trading at an average of $139/MT. The average price in 2017 was $89/MT. A drop in credit prices can be seen on February 21, 2018. This is in direct response to CARB’s Unofficial Rule Making Announcement proposing to decrease the GHG reduction targets from 10% in 2020 to 7.5%. As can be seen in the table below, credit prices have rebounded since that announcement.
When the LCFS was adopted, the compliance curve was “back-loaded” to allow for the development of low-CI fuels and advanced vehicle technology. The program was designed such that the excess credits in the early years would be used to “fund” annual deficits in the latter years of the program. Quarterly credits had always exceeded deficits until 1Q 2017 when the reported deficits were 0.45 million MT in excess of credits. This deficit trend continued through the rest of the year, although deficit generation diminished with each quarter. According to the latest 4Q 2017 data, for the year 2017 LCFS deficits ended 0.11 million MT in excess of credits which resulted in a small drawdown of the credit bank. As the standard gets tougher in 2018 and 2019, we foresee quarterly deficits growing each year as credit generation fails to keep pace with the additional deficits.
How do I learn more?
There’s a bunch more to learn about the LCFS. If you’re looking for a deeper dive, sign up for our LCFS Newsletter. It’s got all the data and exclusive Stillwater analysis you’re looking for.
Stillwater’s LCFS team also offers Bespoke LCFS Credit Balance and Credit Price Outlooks!
Stillwater’s LCFS credit price outlook includes historical LCFS credit balances and prices as a foundation for understanding forward-looking curves. We also present three credit balance and credit price curves through 2031 – our “most likely” curves for both credit balances and credit prices in addition to high and low curves which serve to bound the outlook. Our price projections are based on our analysis of the supply of low-CI fuels in California, the demand for fossil gasoline and diesel, our outlook on carbon intensities of each fuel pool, the evolution of the vehicle fleet, and the ongoing development of the LCFS regulation. Overlaying the numerical analysis is Stillwater’s deep understanding of regulatory actions and the evolution in California, the commercial fuels market, fuels logistics, market structure and players.
Stillwater’s Bespoke, Ten-Year LCFS Credit Balance and Credit Price Outlook includes:
- A table of our annual projected values for LCFS credits.
- Graphs of the supply, demand, and carbon intensity trends that inform our view of the LCFS credit price curve.
- Commentary around CARB’s historic and expected actions to regulate LCFS credit pricing.
- Qualitative descriptions of all key variables and how the data and factors mentioned above influence the forecast.
Stillwater can also run additional scenario investigations utilizing the above-described proprietary model. In this way, Stillwater can evaluate your assumptions and produce unique credit balance and price curves based on these assumptions.
Contact us to learn more about Stillwater’s Bespoke LCFS Outlook!
———————–
*Today, Renewable Diesel is made from fats or vegetable oils in a process similar to that used to produce petroleum diesel. RD is a high-quality fuel that can be blended or “dropped into” petroleum diesel without constraint.

Get expert insights on LCFS, CFP, BC-LCFS, and RFS credit prices.
Stillwater’s Carbon Market Outlooks help fuels producers and investors cut through the noise, navigate carbon market uncertainty, and plan for the future.
Preview a sample reportCategories: News, Policy, White Papers