LCFS 101 – A Beginner’s Guide
Link to article: https://stillwaterassociates.com/lcfs-101-a-beginners-guide/
February 28, 2017
by Megan Boutwell
Not too long ago a friend checked in looking for an LCFS tutorial. Based on that request we decided to put together a handy dandy LCFS guide. We could go on for days about this stuff, but we’ll show a little discipline and just give you the high points. The LCFS can seem like an intimidating collection of acronyms, but it’s really just a fuel-neutral, market based program to develop alternative fuels markets and reduce GHG emissions attributed to transportation fuels used in California.
(When you’re done here, check out our 2018 LCFS 101 update.)
What is the LCFS
California’s Low Carbon Fuel Standard is one of a group of programs designed to reduce greenhouse gas (GHG) emissions enacted through AB 32, the 2006 Global Warming Solutions Act, signed in to law by Governor Arnold Schwarzenegger. The LCFS applies to fuels used for transportation, including gasoline, diesel and their alternatives. The goal of the LCFS is to reduce the carbon intensity (CI) of the transportation fuel pool by 10% by 2020. The LCFS is administered by the California Air Resources Board (CARB). The LCFS was originally adopted in 2009 and became effective in 2011.
The original CI reduction schedule was stayed by the California Appellate Court at 2013 levels due to deficiencies in the original LCFS adoption process. The LCFS was re-adopted in 2015 to remedy the deficiencies and update the program provisions. The re-adopted LCFS became effective on January 1, 2016.
Calculating CI
CI is defined as the lifecycle GHG emissions for a fuel per unit of transportation energy delivered. The CI of a fuel is calculated by assessing the GHG emissions in the lifecycle or “pathway” of the fuel. The pathway is determined by assessing the GHG emissions throughout each stage of the fuel’s feedstock production, conversion, and use. CI is calculated using the GREET model (Greenhouse Gases, Regulated Emissions, and Energy Use in Transportation) developed by the Argonne National Lab. In determining CI, the direct carbon emissions from renewable sources are not included in the calculation. CI is expressed in grams of CO2 equivalent per mega joule (gCO2e/MJ or g/MJ for short).
How does the LCFS work?
Fuels in the California transportation fuel pool that have a CI lower than the target established by CARB generate LCFS credits. Those fuels in the transportation fuel pool with CIs higher than the target generate deficits. A fuel producer with deficits must have enough credits through generation and acquisition to be in annual compliance with the standard.
Petroleum importers, refiners, and wholesalers are Regulated Parties (RPs) under the LCFS. CARB approved alternative fuels producers can opt-in to the program; these participants are also referred to as RPs. When transportation fuels are imported, refined, or sold in California, RPs and opt-in RPs enter the transaction level information into CARB’s central data system for the standard, the LCFS Reporting Tool (LRT). The LRT tracks each transaction of fuel with its corresponding credit or deficit position, and sums for each RP. Credits are retired when used to cover deficits per annual compliance report. LCFS credits do not have a vintage and do not expire. Credit transactions are reported to the LRT, including the transaction price in units of metric tons (MT) of LCFS credits. Credit owners can only sell or trade their credits with other RP deficit holders. Parties outside the 230 RPs are not allowed to hold LCFS credits.
What kind of fuels generate credits?
The low CI fuels generating all the credits include ethanol, biodiesel, renewable diesel, compressed natural gas and biogas (CNG), liquefied natural gas and biogas (LNG), hydrogen, and electricity for electric vehicles (EVs). Currently ethanol is the greatest contributor to the alternative transportation fuel pool. However, because most vehicles are limited to a 10% ethanol/gasoline blend there’s a constraint to how much ethanol can contribute to the overall transportation fuel pool. This is known as the ethanol blendwall. Flex fuel vehicles (FFVs) can run on up to 85% ethanol, but the demand for higher blends of ethanol just hasn’t materialized and CARB has not encouraged the use of E85.
The combined credit contribution of biodiesel and renewable diesel make up the next largest contributor to the alternative transportation fuel pool. Their combined contribution has increased throughout the program. In Q3 2016 biodiesel and renewable diesel made up a combined 47% of the total. The use of biodiesel is hampered by blending limits with conventional diesel, infrastructure constraints, and high feedstock prices. Renewable diesel*, however, shows a lot of promise because as a “drop in” fuel it can replace conventional diesel without making any infrastructure changes.
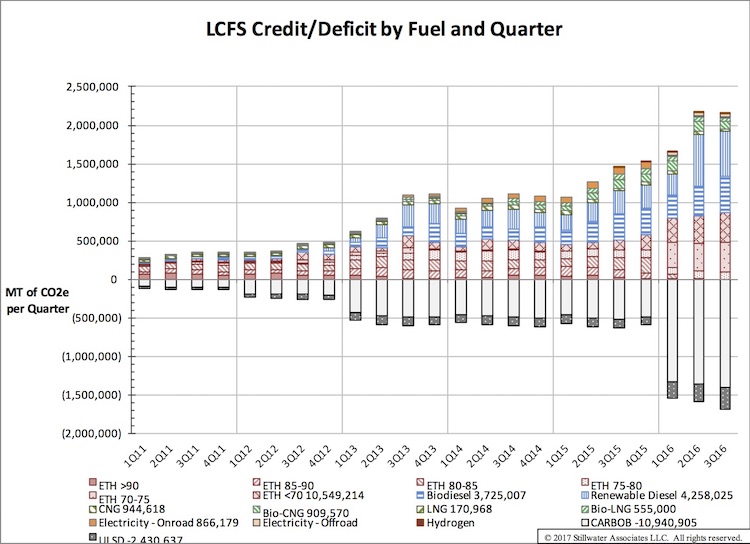
As the program progresses, we expect to see greater contributions from CNG and LNG, especially CNG/LNG derived from biogas as those pathways have very low CIs. Credits from electricity for EVs are expected to increase, but the EV market is small and EV sales have stalled at 3% of the light duty fleet. The fuel with the tiniest contribution to the pool is hydrogen. We don’t expect hydrogen to make any big leaps before 2020. Hydrogen vehicles are expensive and experimental, and the fueling infrastructure just isn’t available.
How’s it going?
According to CARB, low carbon fuel use in California is increasing. That means renewable and alternative fuels are making inroads into displacing gasoline and diesel. CARB also reports that the RPs have over-complied with the LCFS standards every quarter since it was implemented.
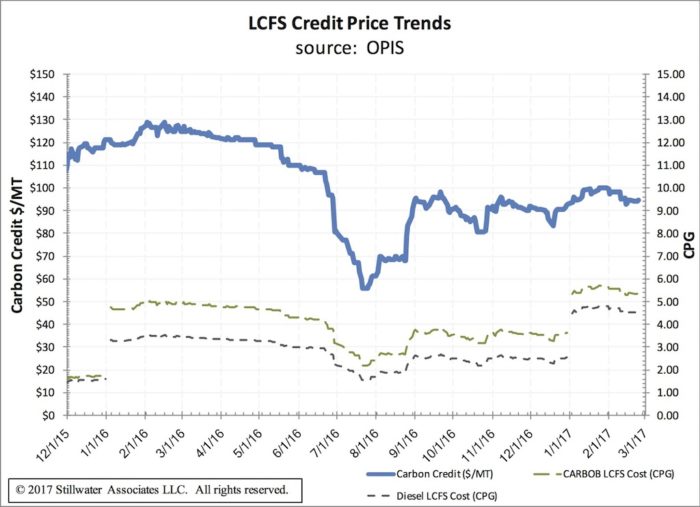
Credit prices have been relatively stable since the standard was implemented, except for a steep decline in prices starting in June 2016 through August 2016. Prices climbed steadily back up through the fall where they are now just under $100/MT. The price crash may have been due to some deal-making in Sacramento when it was rumored that the LCFS might be sacrificed to get corporate buy-in for the Cap and Trade program. Based on our latest Weekly LCFS Newsletter, LCFS credits are trading at an average for 2017 of $97/MT.
When the LCFS was adopted, the compliance curve was “back-loaded” to allow for the development of low CI fuels and advanced vehicle technology. According to the latest quarterly data, the banked LCFS credits are 464,000 MT in excess of deficits. Currently, there are still plenty of credits in the bank to push compliance along for a while. Going into 2018, we see the quarterly credits coming into balance with, or perhaps being less than, the quarterly deficits that are growing as the standard gets tougher. Thus, credit prices will rise unless more credits can be generated. On the positive side, we see credit growth potential in co-processing renewable biocrude at refineries. By using the existing refineries to produce renewable fuels, the timing and potential quantities holds promise. This process does not have a CARB established pathway yet, but they are studying the possibility.
Note: Since the publication of this LCFS 101 article,
we have published a 2018 LCFS 101 update.
How do I learn more?
There’s a bunch more to learn about the LCFS. If you’re looking for a deeper dive, sign up for our LCFS Newsletter. It’s got all the data and exclusive Stillwater analysis you’re looking for.
Stillwater’s LCFS team also offers Bespoke LCFS Credit Balance and Credit Price Outlooks!
Stillwater’s LCFS credit price outlook includes historical LCFS credit balances and prices as a foundation for understanding forward-looking curves. We also present three credit balance and credit price curves through 2031 – our “most likely” curves for both credit balances and credit prices in addition to high and low curves which serve to bound the outlook. Our price projections are based on our analysis of the supply of low-CI fuels in California, the demand for fossil gasoline and diesel, our outlook on carbon intensities of each fuel pool, the evolution of the vehicle fleet, and the ongoing development of the LCFS regulation. Overlaying the numerical analysis is Stillwater’s deep understanding of regulatory actions and the evolution in California, the commercial fuels market, fuels logistics, market structure and players.
Stillwater’s Bespoke, Ten-Year LCFS Credit Balance and Credit Price Outlook includes:
- A table of our annual projected values for LCFS credits.
- Graphs of the supply, demand, and carbon intensity trends that inform our view of the LCFS credit price curve.
- Commentary around CARB’s historic and expected actions to regulate LCFS credit pricing.
- Qualitative descriptions of all key variables and how the data and factors mentioned above influence the forecast.
Stillwater can also run additional scenario investigations utilizing the above-described proprietary model. In this way, Stillwater can evaluate your assumptions and produce unique credit balance and price curves based on these assumptions.
Contact us to learn more about Stillwater’s Bespoke LCFS Outlook!
*Renewable Diesel is made from fats or vegetable oils in a process similar to that used to produce petroleum diesel. RD is a high quality fuel that can be blended or “dropped into” petroleum diesel without constraint.

Get expert insights on LCFS, CFP, BC-LCFS, and RFS credit prices.
Stillwater’s Carbon Market Outlooks help fuels producers and investors cut through the noise, navigate carbon market uncertainty, and plan for the future.
Preview a sample reportCategories: Policy, White Papers