LCFS 101 – A 2022 Refresher
Link to article: https://stillwaterassociates.com/lcfs-101-a-2022-refresher/
January 20, 2022
By Kendra Seymour
It’s been nearly three years since we published an updated 101-level overview of the LCFS. It’s past time. Today, we’re delivering a refresher on the current rules and the latest status of the credit market. Let’s dive in!
What is the LCFS?
California’s Low Carbon Fuel Standard is one of a group of programs designed to reduce greenhouse gas (GHG) emissions enacted through AB 32, the 2006 Global Warming Solutions Act, signed into law by Governor Arnold Schwarzenegger. The LCFS program was originally adopted in 2009 and became effective in 2011. It is administered by the California Air Resources Board (CARB).
The LCFS applies to fuels used for transportation, including gasoline and diesel and their alternatives. The goal of the program is to reduce the carbon intensity (CI) of the transportation fuel pool in California. The current reduction targets set a goal of 10% in 2022, decreasing steadily to a 20% reduction goal in 2030. CARB has indicated that they are considering proposing to strengthen pre-2030 targets in addition to proposing the extension of the targets post-2030, potentially at an accelerated reduction rate, but additional specifics have not yet been offered. Stillwater currently expects the extended targets to go out to 2035 or 2040 with potentially higher annual rates of CI-reduction.
What is Carbon Intensity (CI)?
CI is defined as the lifecycle GHG emissions for a fuel per unit of transportation energy delivered. The CI of a fuel is calculated by assessing the GHG emissions in the lifecycle pathway of the fuel. The pathway is determined by assessing the GHG emissions throughout each stage of the fuel’s feedstock production, conversion, and use. CI is calculated using a California-specific version of the GREET model (Greenhouse Gases, Regulated Emissions, and Energy Use in Transportation) developed by the Argonne National Lab. In determining CI, the direct carbon emissions from renewable sources are not included in the GHG emissions calculation. In other words, tailpipe carbon or carbon emitted from anywhere along the lifecycle is not counted towards the CI if it is from a renewable source; if the tailpipe carbon or carbon emitted from anywhere along the lifecycle pathway is from a fossil source, it is counted towards the CI. CI is expressed in grams of CO2 equivalent per megajoule (gCO2e/MJ or g/MJ for short).
How does the LCFS work?
Fuels in the California transportation fuel pool that have a CI lower than the annual benchmark CI established by CARB generate LCFS credits. Fuels in the transportation fuel pool with CIs higher than the annual benchmark CI generate deficits. A fuel producer with deficits must generate or acquire enough credits to be in annual compliance with the standard.
The LCFS applies to nearly all transportation fuel sold or supplied in California. Suppliers of these fuels are designated Fuel Reporting Entities. Fuels that are not automatically covered by the LCFS can be opted into the program or are exempted from the program. “Opt-in” fuels include electricity, renewable natural gas (RNG), SAF, and renewable propane. Fuels exempted from the LCFS include those supplied in volumes below 3.6 million gasoline gallon equivalents per year in aggregate by all suppliers, conventional jet fuel or aviation gasoline, deficit-generating fuels used for military vehicles, fuel used in locomotives or ocean-going vessels, and fossil propane and CNG used in school buses purchased prior to 2020. All other fuels – including gasoline, diesel, ethanol, biodiesel (BD), renewable diesel (RD), natural gas, propane, renewable naphtha, and hydrogen are, by regulation, covered under the LCFS. Petroleum gasoline and diesel importers, refiners, and wholesalers are deficit-generating Fuel Reporting Entities under the LCFS, generating demand for LCFS credits. Fuel Reporting Entities or Opt-in Entities who supply fuels with a CI below the annual benchmark are credit-generating Entities.
When transportation fuels are imported, refined, or sold in California, Entities enter the transaction-level information into CARB’s central LCFS data management system – the LCFS Reporting Tool and Credit Bank & Transfer System (LRT-CBTS, or LRT for short). The LRT tracks each transaction of fuel with its corresponding credit or deficit position, and sums for each Entity. Credits are retired when used to cover deficits per annual compliance report. Credit transactions are reported to the LRT, including the transaction price in units of metric tons (MT) of LCFS credits (one LCFS credit per MT of CO2 emitted or avoided). Credit owners can only sell or trade their credits to other LCFS deficit holders. Parties outside the (currently 473) registered Entities are not allowed to hold LCFS credits. LCFS credits do not have a vintage and do not expire.
What kind of fuels generate credits?
The low-CI fuels generating credits include ethanol, BD, RD, RNG, natural gas, renewable propane, propane, renewable naphtha, hydrogen, electricity, and SAF. To-date, the combined credit contribution of the largest credit generators (ethanol, BD, and RD) has helped to drive the success of the LCFS while other alternative fuels have taken time to develop technology and markets.
Historically, ethanol was the greatest single contributor to the alternative transportation fuel pool. However, because almost all gasoline in California is limited to a 10% ethanol/gasoline blend by the CaRFG3 regulation, ethanol by volume is limited to what it can contribute to the overall transportation fuel pool. Flex fuel vehicles (FFVs) can run on up to 85% ethanol, but the demand for higher blends of ethanol hasn’t materialized, and CARB has not encouraged the use of E85. In Q2 2021 (the latest volume data available) ethanol generated 20% of all LCFS credits.
The combined contribution of BD and RD has increased throughout the program. In Q2 2021, BD and RD made up a combined 43% of the total credits generated. The use of BD is hampered by blending limits with conventional diesel, infrastructure constraints, and high feedstock prices. RD, however, shows a lot of promise because as a “drop-in” fuel it can replace conventional diesel without any vehicle or infrastructure changes. In fact, over the past three years, RD has eclipsed ethanol as the single largest credit generator under the LCFS.
Meanwhile, as shown in the figure below, credits generated from RNG have shown significant growth in the past two years. Stillwater expects to see increased contributions from RNG as ultra-low CI RNG displaces higher CI RNG. Credits from electricity for electric vehicles (EVs) have also shown promise and are expected to increase appreciably as more than half of all EVs sold in the U.S. are in California, and the state has multiple programs to incentivize EVs and EV infrastructure.
Credit-generating fuels omitted from the chart include hydrogen, propane (fossil and renewable), renewable naphtha, and alternative jet fuel (AJF in the LCFS regulation, also known as SAF). Their contributions to date are so small that they would not show up on this figure. Propane and renewable naphtha are likely to remain very minor contributors due to limited production and application. AJF has the potential to grow significantly, particularly if Congress were to enact a tax incentive for its use (as has been proposed in the current session). Hydrogen could, in the long term, become material if fuel cell vehicles become commercially available and attractive.
Figure 1. LCFS Net Credit/Deficit by Fuel and Quarter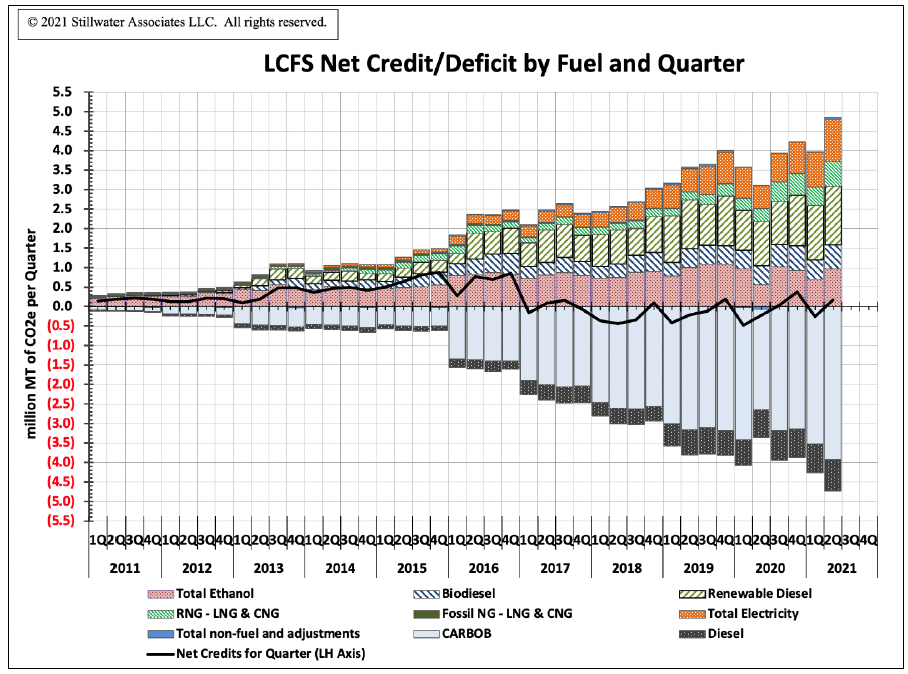
In addition to credit-generating fuels, the LCFS has provisions to generate credits through approved non-fuel activities. Among these are: innovative crude (crude oil produced using methods like solar-generated electricity or steam), Refinery Investment Credits where reductions of GHG emissions in the refining process result, Renewable hydrogen used in refining, Carbon Capture and Sequestration (CCS), and hydrogen and EV infrastructure credits.
How’s it going?
Low-carbon fuel use in California is increasing, which means renewable and alternative fuels are making inroads into displacing gasoline and diesel.
As for the health and viability of the LCFS, CARB reports on the status of the program via quarterly deficit or credit balance reports, and the status of the overall program is most easily viewed in terms of the cumulative LCFS credit bank (i.e. the total accumulated net credits since the program’s inception). If there are insufficient credits to cover deficits, the credit bank will shrink; if there are more than sufficient credits to cover deficits, the bank will grow; if credits match deficits, the bank will plateau. By design, compliance was easier in the early years of the program – CI-reduction targets started small and ratchet up over time. As such, when the LCFS was adopted, the compliance curve was “back-loaded,” allowing credit generation to be relatively easy while the development of low-CI fuels and advanced vehicle technology progressed to meet the more stringent CI-reduction targets to come. The program was designed such that the excess credits in the early years would be used to cover annual deficits in the latter years of the program when the CI-reduction target became more stringent.
The credit bank grew rapidly through 2016, leveled off through 2017, and fell from its peak of about 10 million credits in the third quarter of 2017 through the third quarter of 2020, and has been relatively stable in recent quarters at around 8 million credits. Future declines in the credit bank would be interpreted by the market as a leading indicator of higher credit prices and would be expected to incentivize investment in additional low-carbon fuel projects to supply California. Conversely, growth in the credit bank may be seen as a leading indicator for falling credit prices and, thus, discourage additional investment.
Current credit prices are averaging $150/MT, and over the first ten years of the program, CARB reports that $10.75 billion has changed hands in LCFS credit transactions.
As shown in Figure 2, below, the LCFS program has experienced volatility in credit pricing from the program’s inception through mid-2016. In those early years the standards were intentionally set low enough that deficit generators readily over-complied (and built the credit bank as described above). Simultaneously, the LCFS program faced legal and political challenges, and the original CI reduction schedule for gasoline and diesel was held at 2013 levels until the program was amended and re-adopted in 2015. This combination of over-compliance and legal uncertainty meant that the small volume of credit transactions which did occur were done at low prices. The uncertainty around these early legal and political challenges created volatility in the LCFS credit market which have diminished with resolution of the legal challenges and the increased stringency of program standards with the 2015 re-adoption.
With the “bank” of available credits generally declining over the past four years, credit prices rose, as can be seen in Figure 2 below. This trend was halted when the pandemic hit; LCFS credit prices plummeted in the initial month after California’s stay-at-home orders but rebounded substantially (although not completely to previous levels) in subsequent months. Then, in the third quarter of 2021, LCFS market observers noted a sharp decline in credit prices, likely due to the expectation of increased supply of credits from RD conversions and expansions coming online, as well as growing supply of very low CI digester RNG. As deficit generators carry banks of credits which have no expiration date, they tend to buy credits based on their perceived exposure to the impacts of the scheduled ratcheting of the LCFS targets looking forward over the next few years. Thus, a change in their perceptions of the future supply of credits due to expectation of increasing future RD supplies can quickly influence demand for credits. Meanwhile, credit generators, including electric utilities and small firms needing to service their debt on new facilities, need to continue selling their credits. The net effect is downward pressure on credit prices.
Figure 2. Historic LCFS Credit Pricing (2012-2021)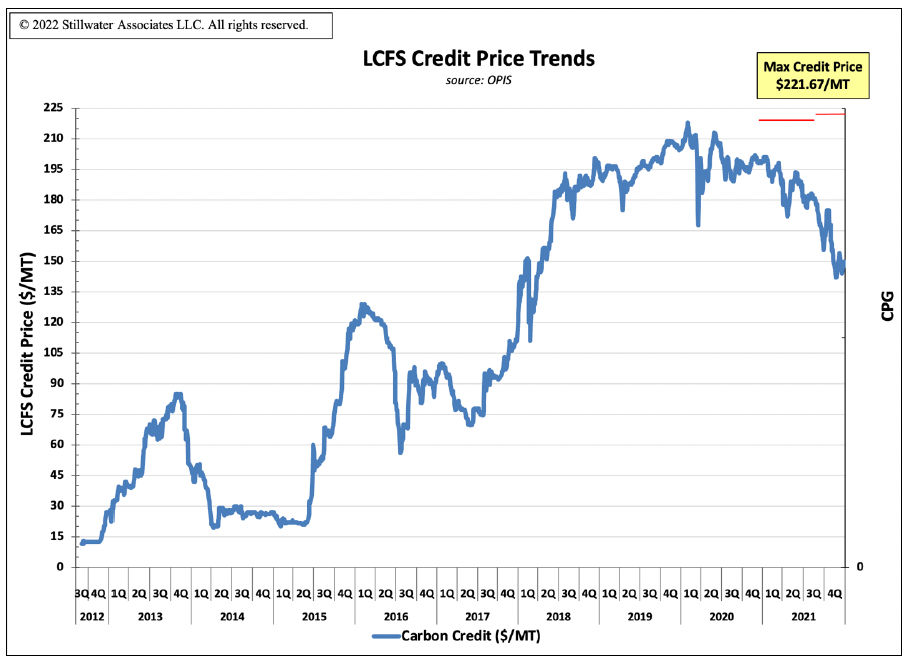
Volatility of credit prices is likely to be high through about 2024 as this timeframe will likely see large increases in RD supply, and CARB is expected to be developing amendments for adoption in late 2023 which will define the program trajectory past 2030 and, possibly, tighten the standards between 2024 and 2030 plus adopt new features regarding various fuels. Stillwater believes that this volatility and uncertainty, in addition to the absence of an active LCFS credit futures market, is currently making it challenging for project developers to secure third-party financing. As a result, projects being developed by parties unable to self-finance may be delayed.
How do I learn more?
There’s lots more to learn about the LCFS. If you’re looking for a deeper dive, sign up for our LCFS Newsletter. It’s got all the data and exclusive Stillwater analysis you’re looking for.
Stillwater’s LCFS team also offers LCFS Credit Balance and Credit Price Outlooks!
Stillwater’s LCFS credit price outlook includes historical LCFS credit balances and prices as a foundation for understanding forward-looking curves. We also present three credit balance and credit price curves through 2031 – our “most likely” curves for both credit balances and credit prices in addition to high and low curves which serve to bound the outlook. Our price projections are based on our analysis of the supply of low-CI fuels in California, the demand for fossil gasoline and diesel, our outlook on carbon intensities of each fuel pool, the evolution of the vehicle fleet, and the ongoing development of the LCFS regulation. Overlaying the numerical analysis is Stillwater’s deep understanding of regulatory actions and the evolution in California, the commercial fuels market, fuels logistics, market structure and players.
Stillwater’s Ten-Year LCFS Credit Balance and Credit Price Outlook includes:
- A table of our annual projected values for LCFS credits.
- Graphs of the supply, demand, and CI trends that inform our view of the LCFS credit price curve.
- Commentary around CARB’s historic and expected actions to regulate LCFS credit pricing.
- Qualitative descriptions of all key variables and how the data and factors mentioned above influence the forecast.
Stillwater can also run additional scenario investigations utilizing the above-described proprietary model. In this way, Stillwater can evaluate your assumptions and produce unique credit balance and price curves based on these assumptions.
Contact us to learn more about Stillwater’s LCFS Outlook!

Get expert insights on LCFS, CFP, BC-LCFS, and RFS credit prices.
Stillwater’s Carbon Market Outlooks help fuels producers and investors cut through the noise, navigate carbon market uncertainty, and plan for the future.
Preview a sample reportCategories: News, Policy, White Papers