Knee-High by the Fourth of July?
Link to article: https://stillwaterassociates.com/knee-high-by-the-fourth-of-july/
June 22, 2019
By Adam Schubert
Rising gasoline prices are making headlines, and though there are many forces at work, one of those contributing factors isn’t receiving the same buzz as others. Corn farmers are facing incredible challenges this year, creating upward pressure on ethanol prices which in-turn increase the prices of the final, blended gasoline. Stillwater is tracking the issue because of its effect on fuel prices, and today we’re offering you a run-down on what we’re seeing.
Just a few months ago, the corn outlook in the U.S. looked entirely different than it does today. The 2018 U.S. corn harvest was the second largest on record and followed two very large harvests in 2016 (the all-time record) and 2017. U.S. corn inventories, as measured by Ending Stocks (the inventory on August 31, before most of the harvest had begun) were at record high levels. The stocks/use ratio (the ratio of Ending Stocks to total demand in the marketing year) had been steadily climbing to pre-RFS levels. Growing trade frictions with China, normally a large buyer of U.S. corn, were putting downward pressure on export volumes. In fact, U.S. farmers were growing concerned that all these factors would lead to falling corn prices, endangering their business.
Figure 1. U.S. Corn Use
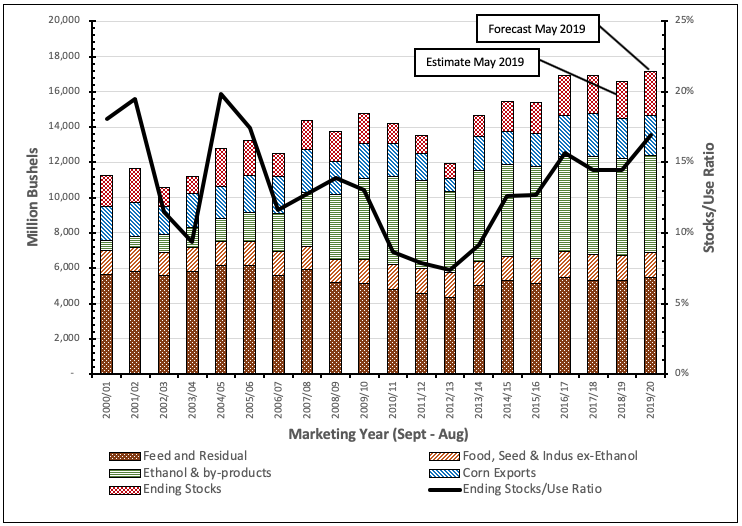
source: USDA World Agriculture Supply/Demand Estimate
Unfortunately, what followed was unusually bad weather in much of the corn belt. First, late-season snowfall in the northern portions of the corn belt delayed the start of planting and began saturating the topsoil and subsoil with water. This late snow was followed by heavy and continuing spring rainfall – up to four times normal levels – resulting in further soil saturation and flooded fields across the heart of the corn belt as shown in Figure 2.
Figure 2. Soil Moisture Ranking Percentile Last Day of May 2019
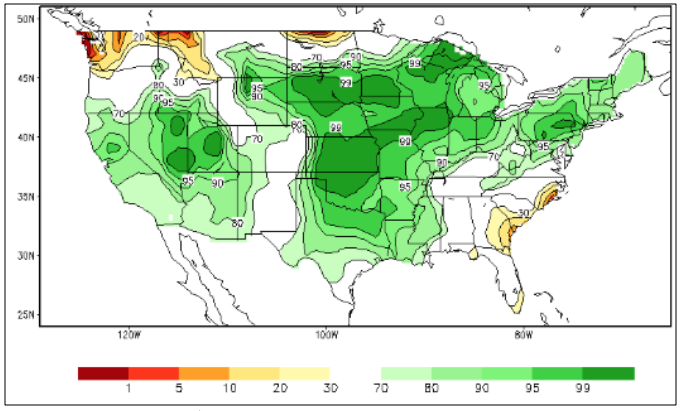
source: National Weather Service/Climate Prediction Center
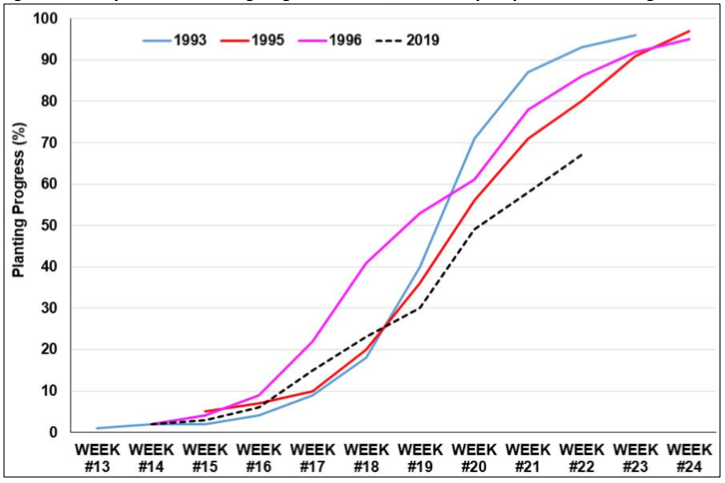
As a result of this uncharacteristically unseasonable weather, farmers are planting corn at a record slow rate. As of June 2nd, the U.S. Department of Agriculture (USDA) estimated corn planting as only 67% complete, compared to the 2014-2018 average of 96% complete by the same date. The shortfall was most acute in Illinois (45% vs 98% average), Indiana (31% vs 94% average), Ohio (33% vs 90% average) and South Dakota (44% vs 96% average). Data on corn planting progress from USDA’s weekly Crop Progress report of June 3rd, 2019 is presented in Figure 3 below. Figure 4, from Scott Irwin at the University of Illinois compares this year’s corn planting progress to other recent years where corn was planted late.
Figure 3. Corn Planted – Selected States
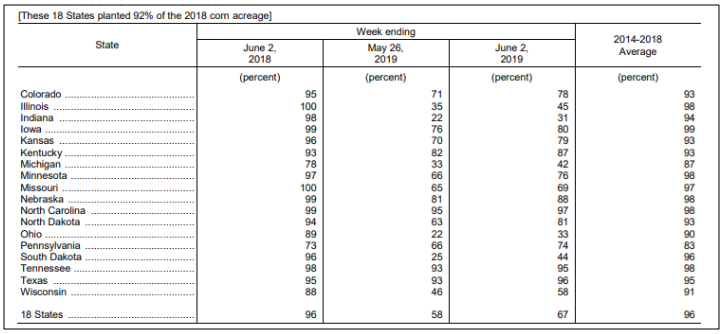
Figure 4. Weekly U.S. Corn Planting Progress in Years of Historically Very Late Corn Planting Since 1980
This severe planting delay presents two key issues. First, delayed planting means that the crop does not reach maturity until later in the Fall. This delay increases the risk of frost damage which will produce a lower yield. Secondly, in order to qualify for maximum crop insurance protection, farmers need to complete planting prior to a specified cut-off date (this date varies geographically due to differences in the optimal growing season and has now passed across the corn belt). When farmers are not able to complete planting prior to the cut-off date, the reduction in insurance places them at greater financial risk at the same time as their projected yield potential is falling. In many years, corn farmers facing this dilemma will make a last-minute switch to planting soybeans. However, last year’s record soybean crop and on-going trade issues with China, the largest export market for U.S. soybeans, means that soybean prices are significantly depressed. The end result of this dilemma may be that large areas of the corn belt do not get planted at all.
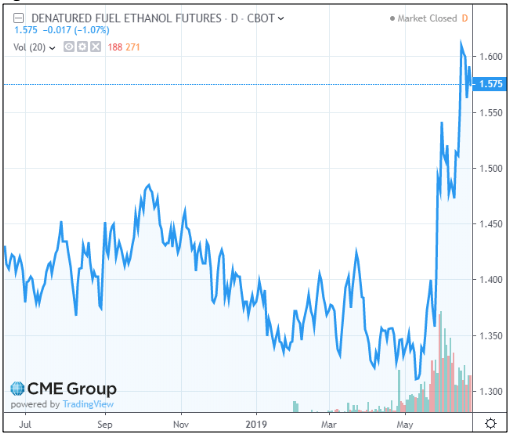
The uncertainty associated with this year’s corn crop can be seen in the evolution of the front month CBOT Corn contract illustrated in Figure 5 below. The jump of more than 100 cents per bushel from mid-May to mid-June can be directly attributed to the delayed corn planting news as it has now emerged. As expected, this trend in corn prices has generated a similar trend in the price of CBOT Ethanol futures as illustrated by the July 2019 futures contract in Figure 6.
Figure 5. Corn Continuous Contract
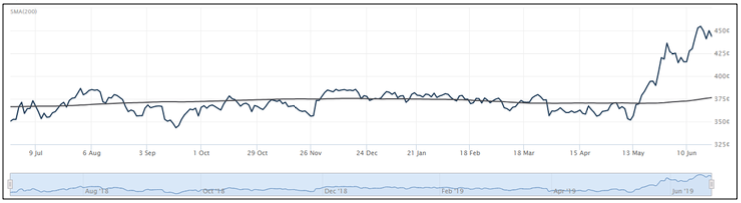
source: quotes.wsj.com
Figure 6. Denatured Fuel Ethanol Futures
The second leading U.S. ethanol feedstock, grain sorghum (milo) is grown in much smaller volumes and in limited geographies where it is suffering from the same weather issues as corn. All the above suggest that there may be continuing upward pressure on ethanol prices until, at least, Fall 2019 when the fate of this year’s U.S. corn crop becomes well understood. If the corn crop comes in at the reduced levels currently feared, this support for ethanol prices can be expected to persist well into 2020.
Categories: Economics