How might a New Mexico LCFS play out?
Link to article: https://stillwaterassociates.com/how-might-a-new-mexico-lcfs-play-out/
August 10, 2021
by Adam Schubert
In the U.S., several programs aim to reduce greenhouse gas (GHG) emissions per unit of energy of fuels used in transportation. California and Oregon both have low carbon fuel standard (LCFS) programs, one Canadian Province (British Columbia) also has a transport fuels GHG-reduction program, and Canada is in the process of rolling out its federal LCFS-style program. Washington state recently enacted its version of an LCFS program which will be implemented in 2023, and several other states (including New Mexico, Minnesota, and New York) are also considering programs to reduce emissions from transportation fuels on the basis of fuel energy.
In this article, Stillwater examines the potential impacts of implementing an LCFS in New Mexico, including how such a standard would affect the supply, demand, and distribution of transportation fuels and how the standard would impact the cost and availability of such fuels.
Overview of New Mexico’s proposed legislation
New Mexico has yet to pass any legislation to establish an LCFS program. For the purposes of this article, it is assumed that the state enacts legislation substantially similar to Senate Bill 11 as introduced to the state senate during the first session of 2021.[1] SB 11 referred to this program as the Clean Fuel Standard (CFS).
Key provisions of SB 11 include:
- Amending the authority of the Environmental Improvement Board to include adding authority to regulate transportation fuels as provided by the CFS legislation and vesting management of the program with the Department of Environment (DoE).
- Charging the DoE with promulgating rules as required to place the CFS into effect within twenty-four months of the effective date of the legislation.
- Regulations to establish an annually decreasing CI standard for transportation fuels, measured in grams of carbon dioxide equivalents per megajoule of fuel energy (gCO2e/MJ) used in New Mexico with 2018 as the baseline year and a minimum 10% reduction from the baseline to be achieved by 2030 and a minimum 20% reduction from the baseline to be achieved by 2040. Further CI reductions beyond this 2040 target to be based on future assessment of technology feasibility.
- DoE to establish a process to determine the CI of all transportation fuels using a nationally or regionally recognized model including the full fuel lifecycle and indirect land use change (ILUC). The supply of fuels with a CI above the annual standard to accrue deficits, measured in metric tons (MT) of carbon dioxide equivalents (CO2e) while the supply of fuels with a CI below the annual standard to accrue credits, measured in MT of CO2
- Fuel pathway applications to be subject to third-party verification. Fuel transactions and CI data to be subject to annual third-party verification at the expense of the party providing fuel or generating credits. DoE to accredit third party verifiers and may accept accreditation of verifiers issued by other states with an LCFS program.
- In addition to the supply of low-CI fuels, credits may also be earned for measures reducing CO2 emissions in agriculture, aviation, chemicals, dairy, energy, film, forestry, manufacturing, mining, oil and gas, waste management, and wastewater treatment.
- DoE to establish a mechanism for fuel providers (a producer or importer of transportation fuels) to comply by securing credits to offset accrued deficits. Providers are required to balance credits and deficits on an annual basis and submit data required for program administration to the DoE.
- Establish a credit market mechanism with rules for transaction fees, a credit price cap, mechanisms for credits to be traded or banked for future compliance, and procedures for verifying the validity of credits and deficits generated under the program.
- Require annual registration of fuel providers and credit generators with registration fees assessed to cover the cost of program administration.
In summary, the program outlined by SB 11 largely mimics the California LCFS and the Oregon CFP with key differences being a different choice of baseline year and a different CI reduction schedule, both consistent with a later starting date than the California and Oregon programs. A potentially important difference is the provision which allows for credit generation from a list of industries outside of the transportation sector; the extent to which these other industries are permitted, and elect to, generate CFS credits in New Mexico could be a significant factor in the supply for credits in the program.
For purposes of this report, it is assumed that the CFS, as outlined above, is enacted by the New Mexico Legislature in its 2022 session, endorsed by the Governor, and enabling regulations are promulgated in a timely manner to allow program commencement on January 1, 2024.
Transport fuels logistics – Current law
Logistics, supply, and demand of transport fuels in New Mexico
New Mexico is currently the third largest crude producing state in the U.S. after Texas and North Dakota. Most of New Mexico’s crude production is exported via pipeline to Texas. The only currently active refinery in the state is the HollyFrontier Navajo Refinery in Artesia which supplies fuels within the state as well as exporting to Arizona and southern Colorado. The Western Refining refinery (currently owned by Marathon Petroleum) shown on the map in Gallup, NM is currently idle and is not expected to restart. In addition to the Artesia refinery, the state is also supplied with petroleum fuels via pipelines from El Paso, TX and from the Valero McKee, TX refinery. Fuels are distributed by tanker truck to retail stations and end-user fleets in New Mexico via terminals located in Albuquerque (four), Moriarty, Bloomfield, Lordsburg, and Artesia, NM and El Paso, TX. These facilities are illustrated in Figure 1 below.[2] As of the third quarter of 2020, there were 660 retail gasoline stations in New Mexico.[3]
Figure 1. Refined Product Supply and Distribution – New Mexico

Currently, there is only one biofuel producer located in New Mexico which is registered as a producer under the Federal Renewable Fuel Standard (RFS) – Rio Valley Biofuels, a BD producer located in Anthony, NM. Rio Valley is not registered with the California LCFS and is not listed as a member of the National Biodiesel Board. U.S. Energy Information Administration (EIA) production data for 2020 does not show any BD production in New Mexico. HollyFrontier is currently in the process of adding a 100 million gallon per year RD unit to their Artesia Refinery with start-up expected in the first quarter of 2022. They are also in the process of building a 200 million gallon per year RD feedstock pretreatment unit at Artesia which will service the RD units at both Artesia and Cheyenne, WY. Due to the high value of LCFS credits in California, it is expected that most of the RD production at Artesia will be trucked or railed into the California market unless the implementation of the proposed NM CFS results in credit prices high enough to make the product more valuable in NM.
According to the EIA Prime Supplier Report data for 2019,[4] New Mexico gasoline sales averaged about 65 thousand barrels per day (KBD), or one billion gallons per year; ultralow sulfur diesel (ULSD) sales averaged about 51 KBD (790 million gallons per year). Stillwater is not aware of any specific data on the ethanol content of gasoline sold in New Mexico but expects that it is predominantly E10.[5] According to the Alternative Fuel Data Center (AFDC),[6] New Mexico has 17 stations (11 public and 6 private) dispensing E85. Diesel fuel sold in New Mexico is mandated to contain a minimum of 5% BD (B5) but that mandate is under suspension from December 16, 2019 through June 15, 2021.[7] Stillwater is also not aware of any specific data on the BD content of diesel fuel currently sold in New Mexico. EIA data on natural gas consumption as vehicle fuel in New Mexico[8] indicates annual demand of approximately 220 million cubic feet (220 billion BTU, HHV or 1.9 million GGE, corresponding to about 0.25% of NM’s ULSD demand),[9] or less than 0.1% of total natural gas demand of nearly 300,000 million cubic feet. The AFDC also indicates that New Mexico has 425 EV charging stations (380 public, 45 private). As of December 28, 2020, EV registrations in New Mexico were 2,046 vehicles.[10]
Value chain for transport fuels consumed and produced in the state
A schematic of the value chain for transport fuels consumed in New Mexico is presented below in Figure 2. The market can be divided into liquid fuels (gasoline and diesel), electricity for EVs, and natural gas for NGVs. The large majority of gasoline vehicles are privately owned and primarily fueled at retail gasoline stations. Many diesel vehicles are owned by fleets with their own fueling facilities in addition to diesel fuel sold at retail to smaller fleets and long-haul diesel trucks transiting the state. Electric vehicles are owned by both individuals and organizations (businesses, non-profits, and government agencies); charging of these vehicles is performed at private residences, private charging stations (primarily organization-owned), and at public charging facilities. NGVs are primarily owned by organizations and fueled at private compressor facilities with compressed natural gas (CNG) or liquefied natural gas (LNG); there is also some retail CNG fueling. The unique aspects of the value chains for liquid fuels, electricity, and natural gas are discussed in the following paragraphs.
Figure 2. New Mexico Transportation Fuel Value Chain
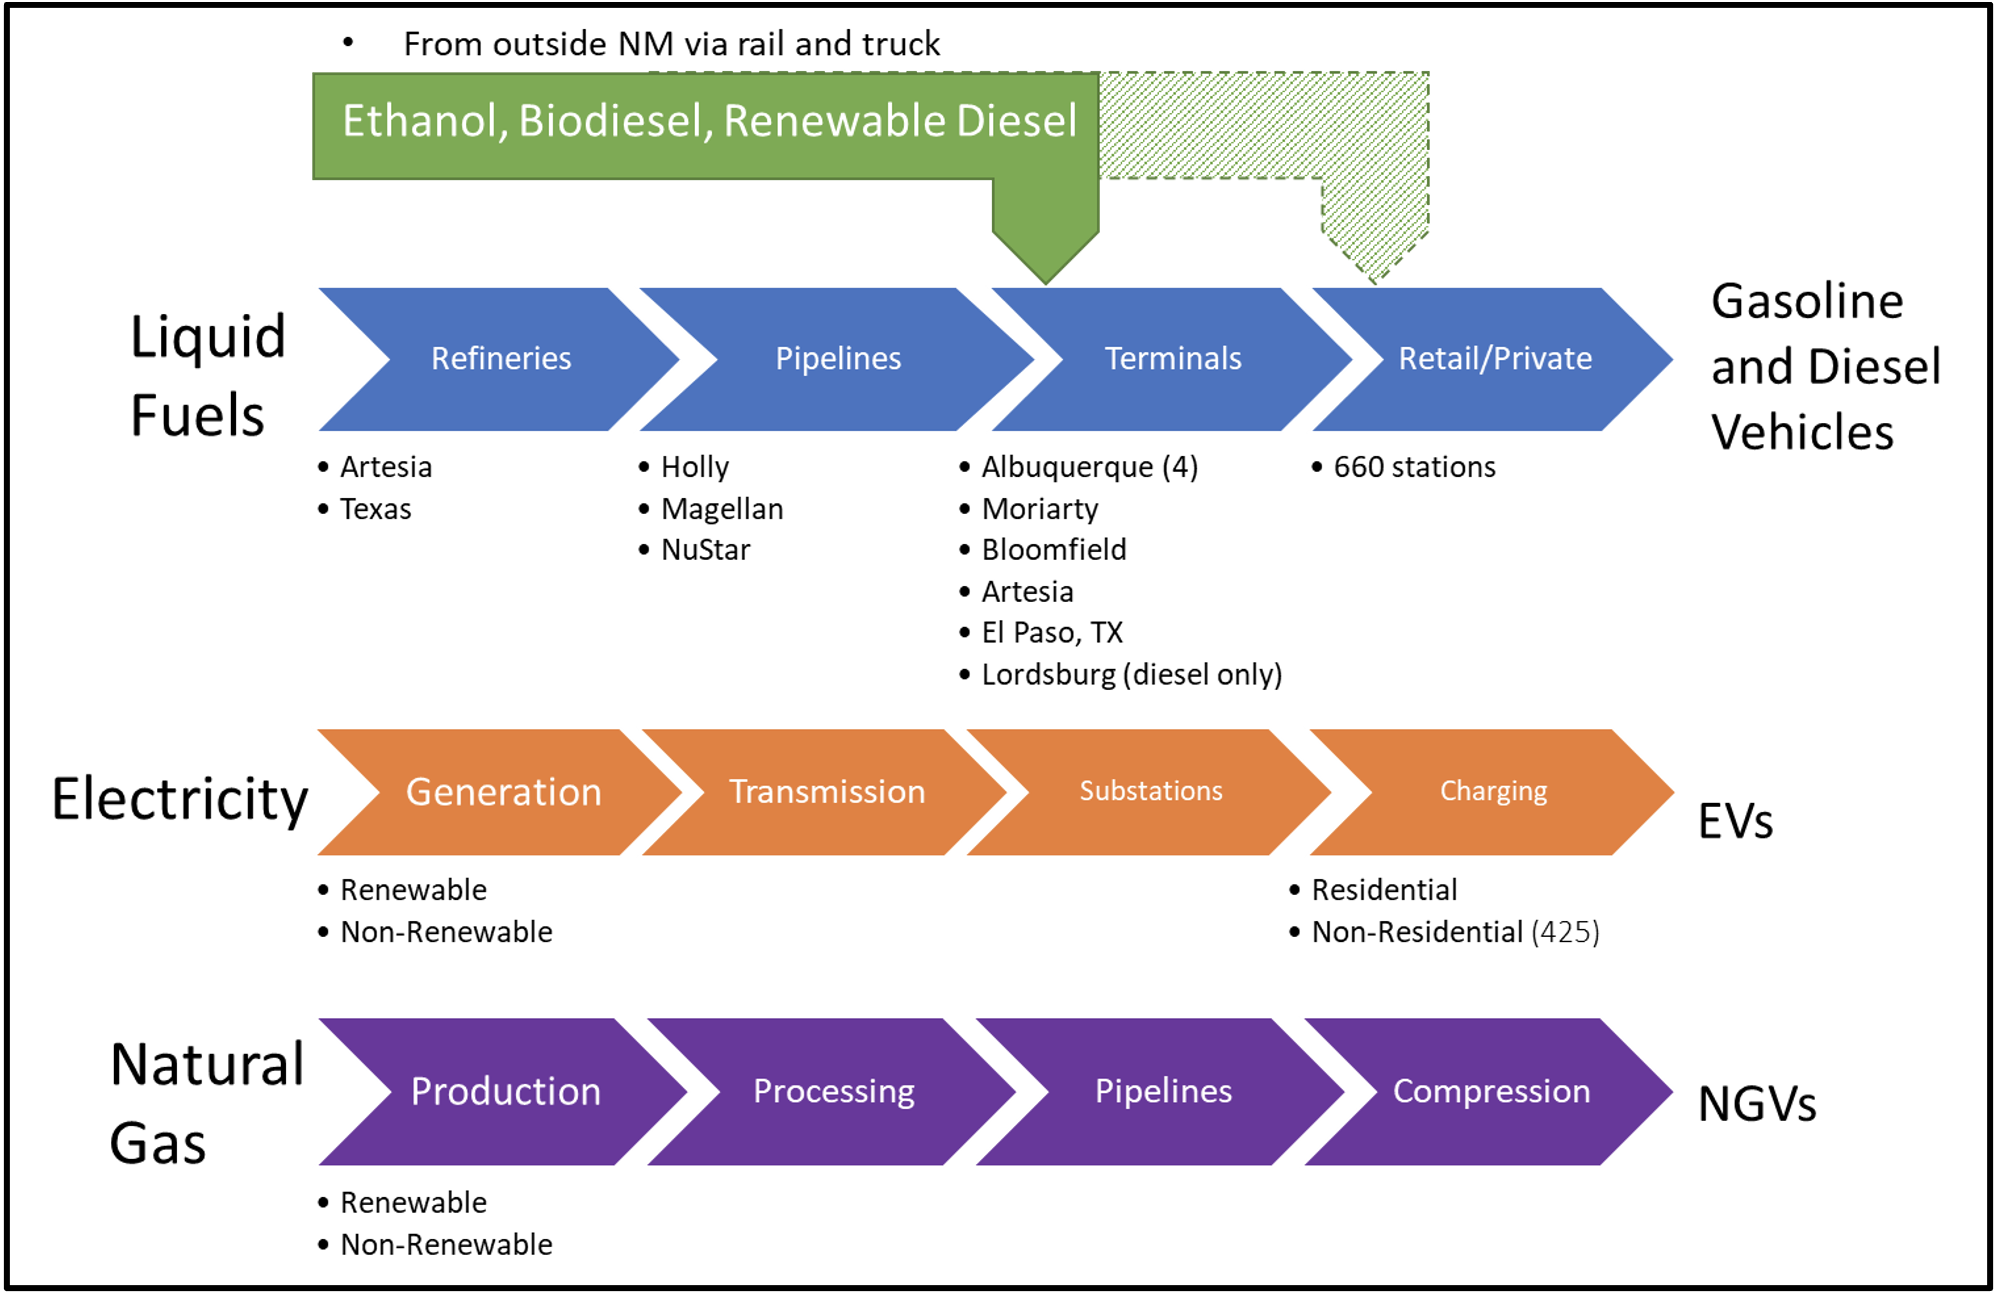
Liquid Fuels Value Chain
- Refineries – The largest component of the liquid fuels value chain are the petroleum refineries. In New Mexico, the HollyFrontier Artesia Refinery (the only active refinery in the state) is the largest supplier with additional supplies coming from the Valero McKee, TX refinery and many additional refineries able to supply El Paso, TX via pipeline connections. In addition to supplying New Mexico, the Artesia refinery supplies Arizona with diesel fuel and the boutique gasoline grade required by the Maricopa County (Phoenix area), AZ market. Arizona is also supplied by refineries in Los Angeles. With gasoline demand in California declining due to increased telecommuting, improving fuel economy, and a growing share of EVs in the California automobile fleet, competition for supply to Phoenix is expected to grow. The California LCFS has also resulted in over 25% of the diesel fuel market in California currently being supplied by BD and RD, thus also increasing competition to place diesel fuel into Phoenix.
- Pipelines – Gasoline and diesel fuel in New Mexico is transported from refineries to distribution terminals via pipeline. The three major pipelines moving these products are Holly Energy Partners (which transports product from the Artesia refinery to terminals in Artesia, Albuquerque, Moriarty (Santa Fe), Bloomfield (Farmington), and El Paso, TX), Magellan Pipeline (supplying terminals in Albuquerque from El Paso, TX), and NuStar (supplying Albuquerque from the Valero refinery in McKee, TX). Additionally, the Kinder Morgan East Pipeline supplies the Lordsburg diesel terminal. This mix of pipelines enables New Mexico to benefit from a diversity of refinery supply, thus enabling market competition and supply reliability in the event of outages at the Artesia refinery. The Magellan and Kinder Morgan pipelines are common carriers where products produced from different refineries are commingled. This mix of pipeline origins became more critical with the idling of the Gallup refinery. Renewable fuels, either neat or in blends with petroleum fuels, cannot typically be transported via pipeline.
- Renewable Fuels (Ethanol, Biodiesel, Renewable Diesel) – As described above, there is no current production of renewable fuels in New Mexico. Due to RFS incentives in the form of RINs, nearly all gasoline marketed in New Mexico is E10 (a blend of 10% ethanol in gasoline), and a significant share of New Mexico’s diesel fuel is believed to be B5. There is no apparent current use of RD in the state as the California LCFS creates a large financial incentive for substantially all U.S. RD production and imports to be used there. It is expected that planned RD production at Artesia will also be sold into the California market; for that RD to be supplied to the New Mexico market under current regulations, the RD value blended in NM diesel including the CPS credits (if the program is adopted) must, at least, equal the RD value in California including LCFS credits less the cost of transporting it to California. The ethanol and BD used in New Mexico is all delivered to the state via truck or railcar with ethanol coming primarily from the Midwest and BD coming from the Gulf Coast or the Midwest. Ethanol blending with gasoline predominantly occurs at terminals as does most BD blending; some BD blending is also performed downstream of terminals.
- Ethanol Production – Fuel-grade ethanol in the U.S. is primarily produced from corn or grain sorghum (milo). Production facilities are generally located where they can source their feedstock within a radius of about 50 miles from the plant. As a result, nearly all plants are located in the corn belt. There are three plants in Texas, three in Colorado, and one in Arizona. Ethanol plants supply terminals within one day’s drive via truck and more distant terminals via rail.
- Biodiesel Production – BD in the U.S. is primarily produced from vegetable oils (soybean oil and non-food grade corn oil produced at corn ethanol plants) with additional production from animal fats (tallow) and used cooking oil (UCO). Most production sites are located near feedstock sources. The diversity of feedstock types has resulted in plants being located across a larger portion of the U.S. than is the case for ethanol. As BD production volumes are typically smaller than ethanol production volumes, truck transport is common with terminals located long distances from production plants supplied by rail.
- Renewable Diesel Production – RD is generally produced from the same feedstocks employed for production of BD, although RD plants generally have more flexibility to handle lower quality feedstocks such as UCO. The largest RD producers in the U.S. (Diamond Green and the Renewable Energy Group, REG) are located on the Gulf Coast and ship substantially all of their product to California by rail or marine vessel. There are some smaller plants located in other parts of the country, including both dedicated RD units and plants located at some petroleum refineries which co-process renewable feedstocks along with petroleum diesel. Additionally, a number of additional plants are currently under development, including a unit at the Artesia refinery. For the foreseeable future, it is expected that substantially all domestic production will be sold in California, driven by the value of the LCFS program credits. The U.S. also regularly imports RD from Neste’s plant in Singapore with substantially all imports arriving by marine vessel in California. As RD is nearly identical to petroleum diesel, it can be sold directly to end users as well as blended with petroleum diesel. RD is stored at petroleum distribution terminals and either blended with petroleum diesel at the terminal or sold neat to retailers and end-user fleets.
- Terminals – Terminals provide bulk storage of petroleum fuels (gasoline and diesel) and biofuels (ethanol, BD, and RD). Petroleum fuels are received via pipeline and biofuels are received via truck or railcar. Products from different producers are generally commingled in common tanks and, thus, must all meet a common set of specifications. Petroleum fuels and renewable fuels are blended at the time when they are loaded onto tank trucks for delivery to retail gas stations or end-user fueling facilities. Importantly, petroleum gasoline produced at refineries and stored at terminals is a sub-octane grade which must be blended with ethanol to meet the octane requirements for retail gasoline. New Mexico has several terminals located around the state in order to minimize the distance that fuels need to be trucked to retail stations or end-user fueling facilities. When terminals have outages (due to supply or maintenance issues) marketers need to draw supply from alternative terminals, potentially incurring increased transportation costs due to longer distances.
- Retail/Private Fueling – Most vehicle fueling occurs at retail gasoline stations; a number of vehicle fleets operating out of a central base location have dedicated fueling facilities. All these facilities, retail and private, receive their fuel via tanker truck from one or more local terminals. The 660 active public gasoline stations in New Mexico are scattered across the state with the highest concentrations in more highly populated areas or along major highways. Regardless of site branding, very few gasoline stations are owned by refiners. Those sites posting a refiner’s brand are generally independently owned and operating with franchise agreements with the refiner which requires them to exclusively market fuel supplied by the refiner. Many sites, particularly smaller sites in rural markets, are individually owned while others may be owned by a wholesaler (“jobber”) who owns a number of sites and leases them to operators. A growing share of stations are owned and operated by regional or national chains (such as QuikTrip). Additionally, a number of large-volume sites located in the parking lots of large format retailers (such as Wal-Mart, Costco, and grocery store chains) are owned and operated by the host retailer. These different ownership models influence marketing and pricing strategies as well as access to capital to invest in the equipment necessary to offer additional fuel products. Monthly fuel volumes at individual retail sites can range from 30,000 gallons/month at small sites in rural markets to over one million gallons per month at large-format stations in high-traffic areas.
Electricity (EV) Fuels Value Chain
While EVs currently consume only a small fraction of electricity used in New Mexico, their charging needs create some unique requirements for the power grid.
- Generation – According to EIA data for 2019,[11] approximately two-thirds of New Mexico’s power generation (23.6 million megawatt-hours, MWh) was provided by utility companies and one-third (11.6 million MWh) by independent power producers (IPP) and combined heat and power plants (CHP, typically owned by industrial users). IPPs sell power to local and distant utilities on both a contract and a spot basis in order to meet varying demand by time of day, day of the week, and season of the year. The total supply generated in New Mexico greatly exceeded in-state retail power demand of 24.9 million MWh. Nearly 42% of generation came from coal, almost 34% came from natural gas, 4% came from solar and 20% from wind. About 71% of retail power sales were from investor-owned utilities, 8% from publicly owned utilities, 1% by the federal government, and 20% from cooperatives. Carbon dioxide emissions from power generation were estimated at 1275 pounds per MWh (579 gCO2/kWh). The distribution of power plants and high voltage transmission lines is shown in Figure 3 below.[12] It may be noted that coal-fired generation is concentrated in the northwest portion of the state, a large share of natural-gas-fired generation is clustered near Albuquerque, and wind and solar generation is broadly scattered with a large share being distant from population centers. New Mexico has implemented a Renewable Portfolio Standard (RPS)[13] which requires that Investor-Owned Utilities (IOUs) supply 20% of their retail power sales in state from renewable generation (of which a minimum of 30% must come from wind, a minimum of 20% must come from solar, and a minimum of 5% must come from other technologies). Rural Electric Cooperatives were required to meet a 10% RPS by 2020. Additionally, IOUs are required to increase the renewable share of their sales to 50% by 2030 and be 100% carbon-free by 2045.[14] Utility implementation of these requirements can be expected to significantly lower the CI of the New Mexico grid power in the coming years.
Figure 3. New Mexico Power Generation and Transmission
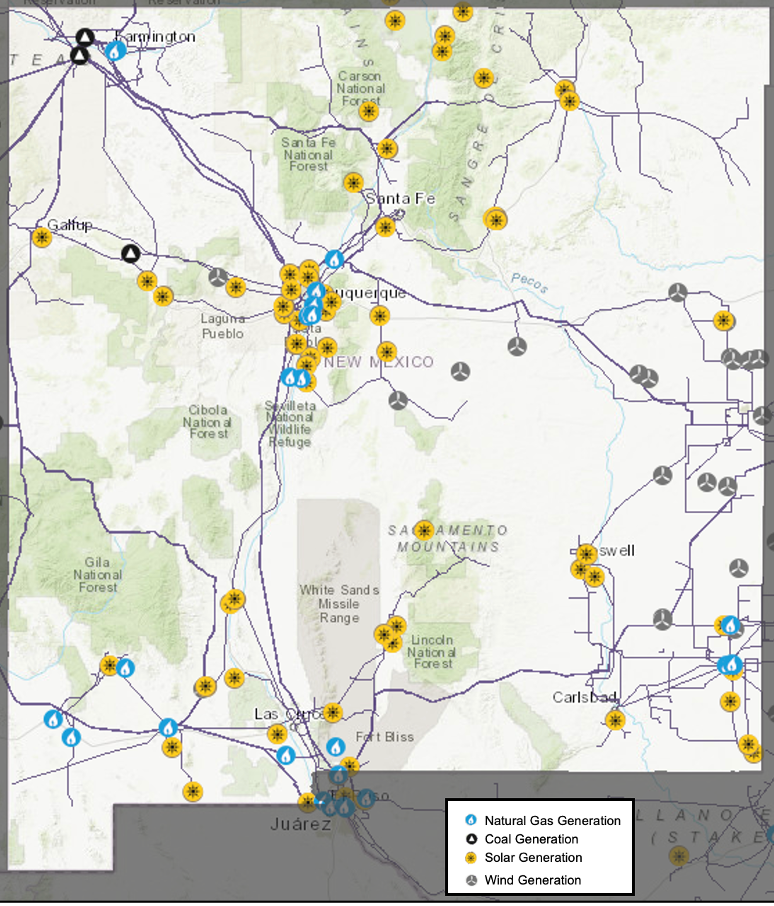
Source: U.S. Energy Information Administration (EIA)
- Transmission – The movement of power from the point of generation to large concentrations of demand is generally achieved through high-voltage transmission lines. These lines are particularly key for solar and wind generation which are often located in more remote areas where large tracts of low-cost land are available. As illustrated in Figure 3, New Mexico has a fairly extensive network of transmission lines to enable connection of solar and wind generation to the power grid.
- Substations – Power substations, typically located near clusters of users, step the power down from the high voltages used for long-distance transmission to the lower voltages required by local end-users. Substations are primarily owned and operated by electric utilities. Growth in power demand in an area or changes in the voltages required generally requires the construction of new substations or the upgrade of existing substations. The mechanisms by which utilities can recover the costs of these additions and upgrades are determined by the state utility regulator, the New Mexico Public Regulation Commission.[15]
- Charging – The charging of EVs, particularly light duty EVs, is generally divided into residential and non-residential categories. Most current EV owners have garages or other suitable off-street parking locations where they can install a personal charger.[16] These residential chargers can be ordinary wall outlets (“Level 1,” using standard 120V service) or dedicated 240V units (“Level 2,” offering faster charging). Due to the required time to fully charge most EVs, Level 1 and Level 2 charging is most practical for locations where vehicles can be left to charge overnight. For EV drivers who cannot install a home-based charger (no garage or who live in multi-family housing) and EV drivers who need to recharge away from home, non-residential chargers are required. To reduce recharge times to a duration compatible with activities such as shopping or dining, high-speed chargers (generally high amperage DC charging) are required. These high-speed units are significantly more expensive than Level 1 or Level 2 chargers and generally require upgrades in local substations or local distribution lines, particularly if multiple chargers are to be sited in a common location. The cost of these required electric infrastructure upgrades can be difficult to pass along for charger units with low utilization. Public chargers can be installed and maintained by utility companies (often in a non-regulated entity), municipal governments, or private firms. State regulations concerning the resale of electricity through a charger can significantly impact the business model or the charging fees for public chargers. Another model for private charging is chargers located at workplaces for either company-owned vehicles or employee vehicles. Chargers to support heavy-duty EVs create additional challenges as those vehicles have larger battery packs and are generally operated by fleets which require multiple chargers at a given site to enable all of their vehicles to be charged during times when they are idle; this creates additional requirements for upgrades of local electrical infrastructure.
Natural Gas Vehicle (NGV) Fuels Value Chain
According to EIA data for 2019, less than 0.1% of natural gas consumption in New Mexico was used for transportation fuel.[17] Nearly all that consumption is in the heavy-duty sector, primarily in centrally fueled fleets.
- Production – Natural gas utilized in New Mexico is nearly all fossil derived, and New Mexico is one of the ten largest gas producing states in the U.S. and a major net exporter with 2019 marketed production of 1,787 billion cubic feet in 2019, almost six times in-state demand. EIA data indicate that over half of in-state natural gas production is from shale gas wells, over 25% is from conventional gas wells, 15% from coalbed methane projects, and the balance is associated gas produced at oil wells. Natural gas production wells are owned by a large number of production companies ranging in size from firms operating a handful of wells to international oil and gas companies (such as Exxon, BP, Shell, etc).
- Argonne National Labs reports that the U.S. has 157 operational RNG facilities with 76 additional facilities under construction and 79 in development as of 2020.[18] None of the currently operational or planned sites are in New Mexico. There is opportunity, however, to develop in-state RNG facilities at dairy and livestock operations, landfills, and waste treatment sites if the economics became feasible.
- Processing – In order to recover natural gas liquids, such as ethane, propane, and butane from the raw natural gas and assure the consistent quality product required by natural gas users, the raw natural gas produced in the field is gathered and processed at gas processing plants located near the production sites before injection into common-carrier gas pipelines. Any RNG which would be produced in New Mexico would need to be similarly upgraded to the same specifications before injection into pipeline systems. Gas processing facilities may be owned by companies with significant production volume in the region or by specialized midstream companies; they will process raw gas from other producers around their plants as well as their proprietary volumes.
- Pipelines – Processed natural gas is injected into high-pressure pipelines for transmission to demand markets. These long-haul pipelines are typically operated as common carriers which, transporting gas marketed by multiple firms and charging shippers tariffs which are regulated by the Federal Energy Regulatory Commission (FERC) for interstate pipelines or the state utility regulator for intrastate pipelines. The pipelines are generally owned by midstream companies which are often organized as master limited partnerships (MLPs) for tax purposes. Pipelines deliver gas to local utility companies who manage supply, delivery, and billing to end-users. Utilities typically operate a mix of high-pressure pipelines to service large volume users, such as power plants, and low-pressure pipelines to service the majority of its customers.
- Compression – Because of its low energy density, natural gas needs to be compressed to high pressures, typically 3,600 pounds per square inch (psi) to enable NGVs to store enough gas to have a driving range suitable for use in local driving applications; this is commonly referred to as CNG. Most NGVs are operated by centrally fueled fleets which operate private compressor stations at their base facilities. These compressor stations represent a substantial investment for fleets transitioning from diesel to natural gas. Larger fleets also maintain their own vehicle maintenance facilities; modifying a diesel service facility to enable servicing of NGVs requires substantial investments in ventilation and electrical equipment in order to mitigate risks associated with the volatility and flammability of CNG. CNG, however, has insufficient energy density to be suitable for long-haul operations. For these applications, natural gas is refrigerated to about minus 260°F to convert it to a liquid (known as liquefied natural gas, or LNG) with sufficient energy density for those applications.
Impacts of an LCFS
Assessment of changes to transport fuel makeup, supply and demand
In this section we offer a qualitative assessment of the likely changes to transport fuel makeup as well as supply and demand as additional states adopt LCFS-style programs. Understanding the potential impacts of SB 11 begins with a qualitative assessment of what changes can be made to the transportation fuels in New Mexico to reduce deficit generation and increase credit generation given the current supply and demand for fuels, the current vehicle fleet, and the timeline to implement the changes required to meet the CI targets of the proposed statute.
An additional factor, so far unique to the proposed NM policy, is the broadly defined provision for generation of credits by industries other than transportation and transportation fuels. This provision is created by Paragraph 3.D.(5) of SB 11 –
D. No later than twenty-four months after the effective date of the Clean Fuel Standard Act, the department shall petition the board to promulgate rules to implement the Clean Fuel Standard Act. The rules shall:
…
(5) establish a mechanism for a person to generate credits, including persons involved in agricultural, aviation, chemical, dairy, energy, film, forestry, manufacturing, mining, oil and gas, waste management or wastewater treatment sectors;
For the bulk of the required rulemaking needed to establish the CFS, DoE can be expected to draw heavily on the experience of CA and OR. For this particular provision, which does not have an analog in CA or OR, the twenty-four months allocated for the DoE to promulgate all of the regulations necessary for implementation of this provision of the CFS, may prove challenging for establishment of a well-defined process giving regulated parties an opportunity to assess the quantity and timeline of credit generation potentially enabled by this provision of the proposed statute. While there are several lifecycle assessment methodologies used in a variety of regulatory and voluntary GHG reduction programs in the U.S. and globally, the DoE will need to select one and establish operational protocols for certification, validation, record-keeping, and reporting of non-transportation fuel credits without being able to draw on analogous provisions in the California LCFS or Oregon CFP. A possible result is that regulated parties under the CFS may be motivated to move slowly in approving significant NM-specific investments in the supply of low-carbon transportation fuels until they can assess the potential scale and timing of credits which may be awarded under this provision.
With that uncertainty in mind, it is possible to qualitatively assess the potential options available for lowering the CI of transportation fuels covered by SB 11.
- Gasoline-fueled vehicles – These currently represent the largest demand for transportation fuels in the state. This demand is currently supplied predominantly by E10 gasoline. The petroleum gasoline portion of these fuels is currently supplied by the HollyFrontier Artesia refinery and imports from the Valero McKee, TX refinery and several other refineries supplying fungible gasoline via common-carrier pipeline from Texas. The ethanol portion of these fuels is supplied by many ethanol plants in the U.S. stored and blended into gasoline at terminals in New Mexico and in El Paso, TX. The diversity of gasoline supply to the state, particularly the volume supplied via fungible pipeline, means that DoE will likely opt, as has CA and OR, to treat all petroleum-derived gasoline as having the same CI. Thus, lowering the CI of blended gasoline requires a combination of sourcing low-CI ethanol or increasing the ethanol content of the blending gasoline.
- The pool of U.S. ethanol production has a wide range of CIs with the lowest CI product currently being segregated for use in CA or OR where it is more highly valued than higher CI ethanol. The implementation of the CFS would create incentive for NM to also receive lower CI ethanol if NM offers better total value to the ethanol supplier than higher CI ethanol. Refiners, who need to cover the deficits accruing due to their supply of petroleum gasoline and diesel to the NM market, need to purchase the CFS credits generated from this use of lower-CI ethanol and can be expected to pass this cost on to consumers.
- The most obvious option for increasing the ethanol content of NM gasoline would be to increase availability of E15. The large majority of vehicles currently on the road in NM (all 2001 and newer light-duty vehicles) have EPA approval for use with E15.[19] Additionally, over 94% of new vehicles currently have manufacturer approval for use with E15[20] (the majority of exceptions are premium-required or premium-recommended vehicles where E15 octane, typically 88 R+M/2,[21] does not meet the manufacturer’s minimum octane recommendation). Broadened retail availability of E15 would require most retailers to invest in new or additional storage and dispensing equipment.[22]
- Electric Vehicles (EVs) – The number of EVs currently registered in NM has recently been reported as 2,046.[23] This compares to 641,838 automobiles and 1,117,575 trucks reported as registered in NM in 2019 by the Federal Highway Administration.[24] New EVs only represent a small fraction of new car sales[25] and fleet turnover is slow as new vehicles sold in the U.S. typically remain on the road for over fifteen years.[26] Accordingly, even if the market share of EVs were to grow rapidly, it would take many years for credits from electricity supplied into EVs to materially contribute credits to the CFS. The CA LCFS and the OR CFP require utilities to utilize a large portion of the revenues realized from credits earned for charging EVs to fund sales incentives for EVs and installation of EV infrastructure. SB 11 does not contain provisions mandating such utilization; even if it did, however, the small size of the current EV fleet would not yield a very significant funding pool. In addition to investment required in a widespread EV charging network, substantial growth in the EV population would also require upgrades to the NM electric grid to support wide availability of high-speed chargers. Also, while the NM power grid does currently contain a large share of wind and solar generation, it also has an above-average share of coal-fired generation which limits the CI reduction which can be achieved with EVs. To materially grow the CFS credit generation from EVs will require both grid upgrades and a reduction in the CI of the NM grid mix; these changes can be implemented gradually as the EV population will take a number of years to grow to material levels.
- Diesel-fueled vehicles – The large majority of heavy-duty vehicles operating in NM are fueled with diesel fuel. The routing of major interstate highways[27] through New Mexico and the resultant long-haul truck traffic means that a substantial portion of diesel sold in the state supports heavy-duty vehicles transiting the state. This fuel is sourced from the HollyFrontier Artesia refinery, the Valero McKee, TX refinery, and fungible product produced from multiple Texas refineries shipping to El Paso, TX via common-carrier pipeline. BD (at blends of up to 5% for nearly all diesel applications and up to 20% for many engines) can readily be blended with petroleum diesel at distribution terminals (the NM 5% BD mandate is currently suspended). Additionally, RD can be used neat or at any blend level (with or without BD in the mix) with petroleum diesel. Accordingly, increased blending of BD and RD in the diesel pool can be utilized with the current diesel fleet to generate substantial volumes of CFS credits in the near-term with volumes growing over time as U.S. production of RD is planned to rapidly increase.
- Natural Gas Vehicles (NGVs) – NM currently has a small population of NGVs which are primarily fueled with fossil natural gas. That fossil natural gas can be completely replaced with RNG without any vehicle or infrastructure modifications. California’s LCFS incentives have, as of the fourth quarter of 2020, resulted in over 98% of NGV demand being supplied by very low CI RNG. As RNG production, incentivized by the LCFS and the RFS has grown rapidly, there is a growing abundance of RNG production nationally (CA LCFS regulations address the challenge of delivery to in-state vehicles by allowing book-and-claim accounting to be used to associate RNG production anywhere in the U.S. to demand in California.) Accordingly, rapid penetration of RNG in the NM NGV fleet could be achieved if book-and-claim accounting is employed.[28] California, however, is relatively unique in the U.S. with respect to the high penetration of NGVs in the heavy-duty transportation sector; this is the result of long-standing state incentives and regulations aimed at driving diesel fleets to convert to NGVs. As a result, the credit generation opportunity accessible through RNG in NM is much smaller than has been the case in CA but could grow significantly if national LNG fueling infrastructure were to be built out, including along the major interstate corridors transiting NM.
In summary, the most likely near-term sources of CFS credit generation are limited by the capabilities of the existing vehicle fleet in the state. These include attracting lower CI ethanol for use in gasoline as E10 blends, increasing the availability of E15 and growing the share of BD and RD in the diesel fuel mix. Achieving these changes will require CFS credit prices to increase to levels needed to compete with California and Oregon for supplies of these fuels. Additional costs would be incurred to increase the retail availability of E15; these costs would need to be borne by retailers, few of which are owned by fuel providers and many of which are small businesses operating on narrow margins – making that investment would require some combination of government grants or higher prices for consumers. EVs may be able to make a material contribution over the long-term. For that to happen, however, would require a number of years to grow the EV population in the state, significant investment in the power grid and chargers, and an increasing share of low-carbon power generation in the state’s grid. RNG offers a readily accessible opportunity to reduce GHG emissions generated by the state’s NGVs, but the small existing NGV population makes that a limited opportunity. Growth of the NGV fleet would likely require a policy mix of fleet regulations and incentives for investment in NGVs and support infrastructure in addition to the CFS; fleets can be expected to show reluctance to make any investment in NGVs so long as they see an evolving policy environment which will be pushing electrification.
Likely sources of supply for low-carbon fuels
Ethanol production in the U.S. is primarily concentrated in regions where the plant can be supplied with feedstock grown within about a 50-mile radius of the plant. This is due to the high cost of shipping whole corn relative to value added through the conversion to ethanol. As a result, plants are located primarily within the corn belt. Over the past five harvest seasons (2016 through 2020), New Mexico’s corn harvest has averaged about 6.4 million bushels, or less than 0.05% of total U.S. corn production.[29] Even if all of New Mexico’s corn harvest were used to produce ethanol locally, that would amount to only 18.6 million gallons per year out of the 100 million gallons required to blend New Mexico’s current annual retail gasoline demand (about 1 billion gallons) as E10. Accordingly, New Mexico can be expected to remain reliant on ethanol supplies sourced from the Midwest if SB 11 were to be enacted. Any growth in ethanol demand to enable sales of E15 or other higher ethanol blends would further increase dependence on out-of-state ethanol supplies while reducing demand for petroleum gasoline refined in New Mexico or Texas. The U.S. ethanol industry currently exports a significant portion of its production; this excess capacity could readily be utilized to supply any increase in demand in New Mexico.
While most BD plants are also located in proximity to feedstock production, the higher energy density of the feedstock, the fact that most plants need to source multiple feedstock types, and potential scale economies has enabled plants to be built further from feedstock sources. RD plants are more capital-intensive than BD plants and typically built at a larger scale. Thus, although they utilize the same feedstocks as BD producers, RD producers require larger volumes of feedstocks than can typically be sourced from local production and are more likely to site their plants where they can take advantage of existing production and logistics infrastructure. Accordingly, HollyFrontier has chosen to invest in an RD unit in Artesia even though New Mexico is not a significant producer of soybean oil, corn oil, tallow, or other common feedstocks. Accordingly, it may be possible to site an additional RD plant in NM at the idled Gallup refinery, taking advantage of existing infrastructure, any such investment is likely to be reliant upon feedstocks produced outside of the state. The existing surplus of U.S. BD production capacity and an expected surplus in U.S. RD production capacity suggests that increased demand for these fuels in New Mexico could readily be supplied from domestic producers.
There is potential for production of significant quantities of RNG in NM from existing and future landfills, water-treatment plants, and dairy and livestock facilities. In addition, RNG produced out of state can be sold into vehicles in NM via book-and-claim accounting (assuming NM implements regulations similar to those in CA and OR). Potential transportation fuel demand for RNG in NM, however, is currently quite limited due to the relatively small numbers of existing NGVs in the state; transitioning existing diesel fleets to NGVs is possible but would likely require either mandates or greater incentives than currently available. RNG can also be used to provide CFS program credits through the production of renewable hydrogen for petroleum refining and RD production, as well as in fuel cell vehicles (FCVs). Further, use of RNG instead of fossil natural gas in power generation could produce low-CI electricity for use in powering EVs. Additionally, the New Mexico RPS permits RNG to be used to meet a portion of utility’s renewable obligation. With U.S. RNG production rapidly growing, and California CNG demand being almost fully supplied with RNG, there is likely to be sufficient surplus U.S. RNG production capacity to satisfy the limited needs of NGVs fueled in New Mexico.
New Mexico already has a significant existing base of wind and solar power production, accounting for 24% of in-state generating capacity, some of which is currently used to generate LCFS credits in California via book-and-claim accounting. With adoption of EV charging regulations similar to those in the LCFS, this could be a source of low-CI electricity significantly larger than the demands of the current EV fleet in the state. There is likely also significant opportunity to grow this renewable power capacity; the rate of growth of the state’s EV population will be the primary limit on how much renewable power could be utilized for generation of credits for the CFS and other programs, such as the California LCFS, which offer credits for renewable power sold into the state for EV charging.
While many groups have sought to develop commercial technologies for production of transportation fuels from waste materials such as municipal solid waste (MSW), wood waste, and captured carbon dioxide (feedstocks potentially available in NM), none of these technologies have been successfully demonstrated at commercial scale, and developers are unlikely to invest in these technologies in NM until, at least, the market demand and value of the potential CFS credits are apparent and the scale of credit generation approved by other industries (discussed at the beginning of this “Impacts of an LCFS” section) are better understood. Use of these potential feedstocks to produce fuels other than ethanol, RD, RNG, or electricity would also require development of the value chain necessary to bring those fuels to market.
Availability and cost of transport fuel to consumers
The cost to New Mexico consumers to achieve the 10% CI reduction by 2030 as proposed in SB 11 will depend on key factors including:
- The calculation methodologies adopted by the DoE; this report assumes that the methodologies will be substantially similar to those in place for the California LCFS.
- The rate at which the NM vehicle fleet turns over to alternative technologies such as EVs, FCVs, and NGVs. This may be influenced by mandates and incentives other than the CFS.
- The number and size of additional states which may adopt similar programs in this timeframe. Further growth in the number of LCFS states will drive competition for potentially limited feedstocks and low-CI fuels.
- The structure which the DoE adopts for rewarding CFS credits for industries outside of transportation fuels and the resultant rate of non-transportation credit generation.
Looking at the current California LCFS program as a benchmark for comparison, Stillwater has recently estimated LCFS costs at 23.6 cents per gallon of gasoline BOB and 23.3 cents per gallon for ULSD[30] while targeting an 8.75% CI reduction in 2021.
Factors which may cause the NM CFS to be more costly to achieve the proposed 10% CI reduction by 2030:
- Each increment of reduction becomes increasingly costly as it requires bigger changes in the fuel mix. Conservatively assuming that the increase is linear going from 8.75% to 10% CI reduction, this would increase the estimate to 27.0 cents per gallon for gasoline BOB and 26.6 cents per gallon for ULSD.
- The NM vehicle fleet currently has a much smaller proportion of EVs, FCVs, and NGVs than does California’s. If the market share of those vehicles does not catch up with California levels, the NM program would not benefit from the zero and negative CI fuels which can be used to fuel those vehicles. In the fourth quarter of 2020, these fuels (RNG, electricity, and hydrogen) accounted for over 31% of LCFS credit generation,[31] and this share has been steadily growing. If the NM vehicle fleet does not transition to a mix similar to that of CA, then NM would need to compensate by accelerating retail availability of E15 and blending a larger share of BD and RD into the diesel pool.
- While jet fuel does not generate deficits in the CA LCFS or the proposed NM CFS, CA allows renewable jet (RJ, also known as sustainable aviation fuel, SAF) to generate credits. To date, this has only been a minimal source of credits generated for the LCFS but is expected to grow in the coming years, especially if the federal government were to approve additional incentives for adoption of RJ/SAF as has been proposed in the current session of the U.S. Congress. While this could be a substantial credit generator in CA, due to the large jet fuel demand for trans-Pacific and coast-to-coast air travel out of Los Angeles and San Francisco, demand for jet fuel in NM is much smaller, as shown in Figure 4 below.
- Washington state has recently enacted an LCFS program scheduled to take effect in 2023. Other state legislatures, such as New York and Minnesota are also considering LCFS programs in their current sessions. The implementation of additional state programs increases competition for the lowest CI fuels, driving up compliance costs in all jurisdictions.
There are also factors which may serve to reduce the potential compliance costs of the proposed NM program relative to what has been observed in CA:
- NM has already approved the use of E15[32] (California has not). While current market share of E15 is very small, recent relaxation of EPA requirements for E15 have lowered the cost for retailers to expand availability and implementation of the proposed CFP would create a strong incentive for increasing market share. The use of E15 in place of E10 reduces the number of deficits generated while increasing credit generation, thus lowering compliance costs. (Note: A recent ruling by the D.C. Circuit Court of Appeals has voided this action by EPA. EPA and ethanol producers are currently considering whether to appeal this ruling, and there is also potential for Congress to intervene with new legislation.)
- As shown in Figure 4, NM has a much higher share of diesel fuel in its transportation fuel mix than does CA. Experience in CA has demonstrated that large shares of BD and RD can be readily incorporated in diesel fuel with minimal investment in terminalling and logistics infrastructure. Substantial investments in RD production capacity are already being made, including at the HollyFrontier Artesia refinery. The primary limitation to this potential compliance option is a potential scarcity of suitable, low-carbon feedstocks to enable continued growth in BD and RD production.
Figure 4. Transportation Fuel Demand 2018 (thousand barrels)
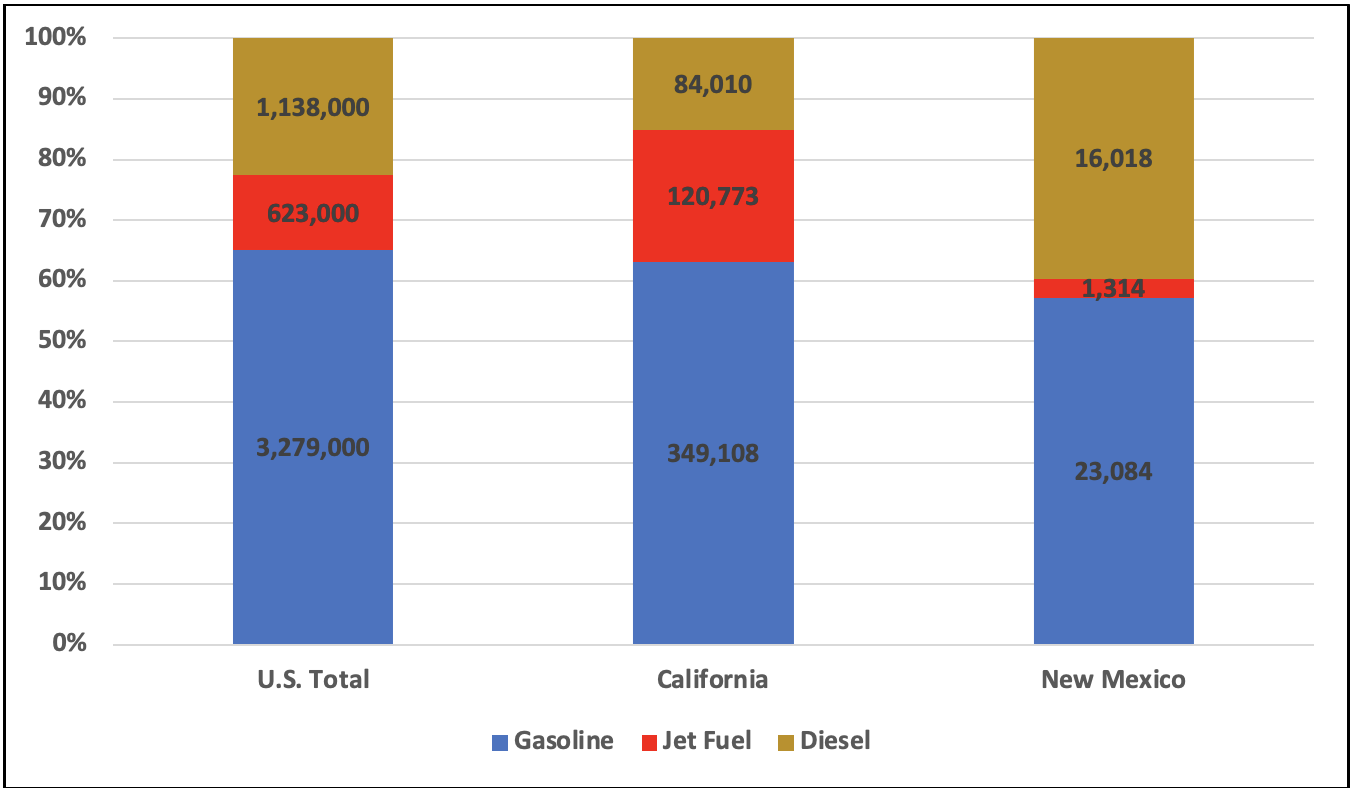
Source: EIA[33], Stillwater analysis
- The option for credit generation by industries outside of transportation as allowed by SB 11 may provide a significant pool of credits for which there is no counterpart in the CA program. The potential for credit generation in these other industrial sectors will depend on regulations that will need to be crafted by the DoE to implement this option.
[1] This bill with amendments was approved by the Senate on a 25-14 vote on March 11, 2021. It was then referred to the House Energy, Environment and Natural Resources Committee (HENRC) which reported it to the full House with a Do Pass recommendation. The legislature adjourned without a vote by the full House.
[2] East Coast and Gulf Coast Transportation Fuels Markets, a report prepared by ICF International for EIA, February 2016, https://www.eia.gov/analysis/transportationfuels/padd1n3/pdf/transportation_fuels_padd1n3.pdf.
[3] U.S. Bureau of Labor Statistics, Quarterly Census of Employment and Wages, Private NAICS 447 Gasoline Stations, All counties in New Mexico, https://data.bls.gov/cew/apps/table_maker/v4/table_maker.htm#type=2&st=35&year=2020&qtr=3&own=5&ind=447&supp=0.
[4] https://www.eia.gov/petroleum/marketing/prime/#tabs-volumes-1.
[5] New Mexico approved the use of E15 in 2019 (https://growthenergy.org/2019/05/01/growth-energy-new-mexico-becomes-31st-state-to-add-e15-choice-at-the-pump/). e85prices.com indicates that six retail stations in New Mexico, all in the Albuquerque area currently offer E15.
[6] https://afdc.energy.gov/states/nm
[7] https://afdc.energy.gov/fuels/laws/BIOD?state=NM.
[8] https://www.eia.gov/dnav/ng/ng_cons_sum_dcu_SNM_a.htm
[9] Gasoline Gallon Equivalents, 119.53 MJ.
[10] PNM wants to make electric car ownership cheaper, Santa Fe New Mexican, December 28, 2020, https://www.santafenewmexican.com/news/local_news/pnm-wants-to-make-electric-car-ownership-cheaper/article_24bfd0ca-44ae-11eb-a1c7-17a41bdf9c8b.html#:~:text=The%20electric%20vehicle%20count%20in,New%20Mexico%20Motor%20Vehicle%20Division.
[11] New Mexico Electricity Profile 2019, https://www.eia.gov/electricity/state/newmexico/.
[12] EIA State Energy Profile for New Mexico, https://www.eia.gov/state/?sid=NM.
[13] http://www.nmprc.state.nm.us/utilities/renewable-energy.html#gsc.tab=0.
[14] https://programs.dsireusa.org/system/program/detail/720.
[15] http://www.nmprc.state.nm.us/utilities/index.html#gsc.tab=0.
[16] Residential EV charges are generally metered by the electric utility who then earns the associated LCFS credits.
[17] https://www.eia.gov/dnav/ng/ng_sum_lsum_dcu_SNM_a.htm.
[18] https://www.anl.gov/es/reference/renewable-natural-gas-database.
[19] E15 is not approved for use in motorcycles, non-road engines, and heavy-duty gasoline engines. Accordingly, E10 or E0 would need to be retained in the marketplace for those applications.
[20] https://ethanolrfa.org/wp-content/uploads/2020/11/E15-Approval-Status-for-U.S.-LDVs-MY12-21.pdf.
[21] While there is nothing preventing the production and supply of premium E15, it is not currently done due to limited perceived demand.
[22] This investment is relatively modest for new or rebuilt stations but can be substantial for existing stations depending on their existing equipment. Many existing retail installations around the U.S. were partially funded through federal or state grants.
[23] PNM wants to make electric car ownership cheaper, Santa Fe New Mexican, December 28, 2020, https://www.santafenewmexican.com/news/local_news/pnm-wants-to-make-electric-car-ownership-cheaper/article_24bfd0ca-44ae-11eb-a1c7-17a41bdf9c8b.html#:~:text=The%20electric%20vehicle%20count%20in,New%20Mexico%20Motor%20Vehicle%20Division.
[24] State Motor Vehicle Registrations – 2019 as reported in November 2020, https://www.fhwa.dot.gov/policyinformation/statistics/2019/mv1.cfm
[25] In 2019, U.S. new car sales were 17 million vehicles (https://www.spglobal.com/marketintelligence/en/news-insights/latest-news-headlines/us-auto-sales-decline-1-4-in-2019-car-sales-plummet-as-trucks-suvs-gain-56480367) and only 331,000 of those vehicles were EVs (https://www.spglobal.com/platts/en/market-insights/latest-news/electric-power/012821-us-ev-sales-tumble-in-2020-but-ev-load-increases-with-more-charging-stations), for a 1.9% share.
[26] The U.S. car and truck fleet, as reported by the Federal Highway Administration for 2019 was about 267 million vehicles and new light-duty vehicle sales in 2019 were 17.1 million vehicles (https://www.cnbc.com/2020/01/06/us-auto-sales-down-in-2019-but-still-top-17-million.html) implying an average lifetime of 15.6 years assuming a steady vehicle population (267 million vehicles ÷ 17.1 million vehicles/year = 15.6 years)
[27] Including I-10, I-40, and I-25 connecting Los Angeles to much of the southern, eastern, and midwestern U.S.
[28] As New Mexico is a large net exporter of fossil natural gas, wholesale prices are low compared to the national averages. As a result, CFS credit prices need to be somewhat larger then required in other states to attract RNG of a given CI.
[29] U.S. Department of Agriculture, QuikStats, https://quickstats.nass.usda.gov/.
[30] This is for CARBOB to produce California Reformulated Gasoline when blended with 10% ethanol and CARB ULSD, respectively. Costs cited include the current cost of the incremental crude provisions of the regulations. Full report can be found at: https://stillwaterpublications.com/newsletters/weekly-lcfs-newsletter-may-19-2021/
[31] In 4Q2020, RNG in California generated 0.55 million credits, electricity 0.81 million credits, and hydrogen 0.01 million credits for a total of 1.37 million credits out of total credit generation of 4.34 million.
[32] New Mexico Energy, Minerals, and Natural Resources Department http://www.emnrd.state.nm.us/ECMD/CleanFuelsandEfficientTransportation/Ethanol.html
[33] EIA State Energy Demand System, https://www.eia.gov/state/seds/data.php?incfile=/state/seds/sep_use/tra/use_tra_US.html&sid=US.
Tags: CFP, CFS, LCFS, New Mexico, NMCategories: Economics, News, Policy, Technology Development