COVID-19 and the LCFS: Ain’t No Sunshine
Link to article: https://stillwaterassociates.com/covid-19-and-the-lcfs-aint-no-sunshine/
The COVID-19 crisis has grown to outsized proportions – both globally and in the U.S. – as the number of cases and fatalities have grown exponentially. March 16th wasn’t all that long ago, but it feels like an eternity. That was the day California was turned upside down when officials in the seven counties around and including San Francisco issued “shelter-in-place” orders for their seven million residents. Then, on March 19th, Governor Newsom issued a statewide “stay-at-home” order. In the two weeks since then, most other states, counties, and cities across the U.S. have issued similar orders so that now roughly 90% of the U.S. population has been ordered to stay home except for essential activity. This is, of course, in addition to federal social distancing guidelines in place since March 16th and now extended until at least the end of April.
The coronavirus has certainly drained value out of the economy. Here’s a look at some selected trends:
Figure 1. Dow Jones Average – Trend and Daily Change
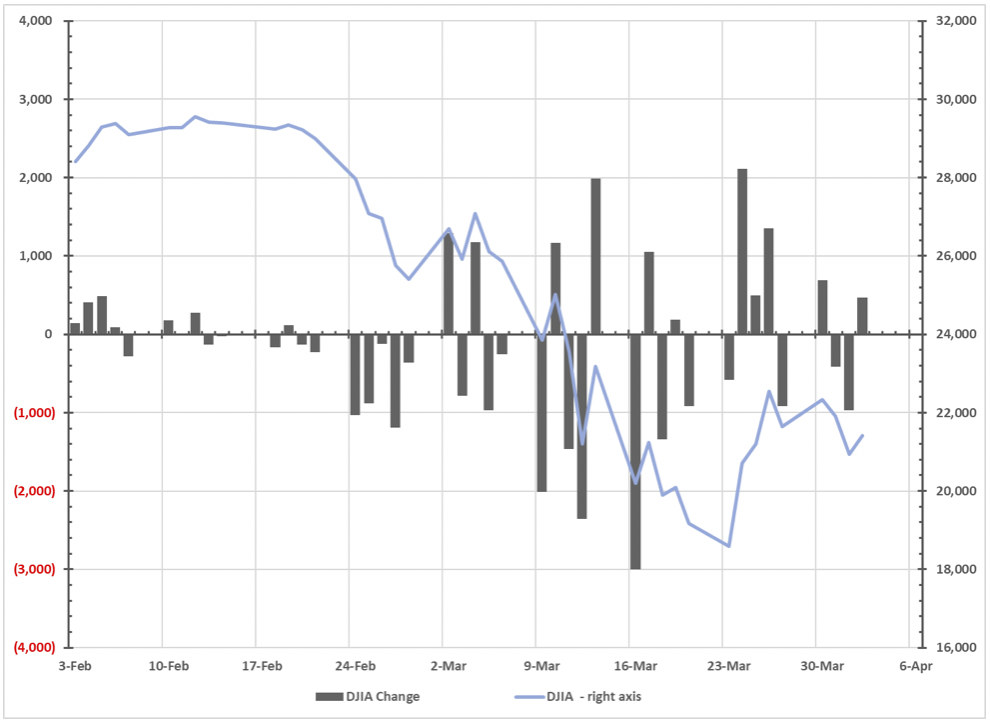
Headlining the trends shown in Figure 1 is the fact that 1Q2020 was the market’s worst first quarter in 124 years. A look at the Dow Jones Industrial Average trends reveals the uncertainties around the severity and longevity of the crisis. The fact of the matter is that we are still in the early days of this coronavirus marathon even though mid-February, when this crisis began to unfold in the U.S., feels like a distant memory for most. One glimmer of hope: It appears that the market volatility has decreased this week.
Today, we take a look at two specific areas of the economy which have taken a significant hit from the COVID-19 fallout – air travel and transport energy.
Air Travel
As shown in Figure 2 below, passenger air travel fell off significantly in March.
Figure 2. Number of Travelers Passing Through TSA Checkpoints (2020 vs 2019)
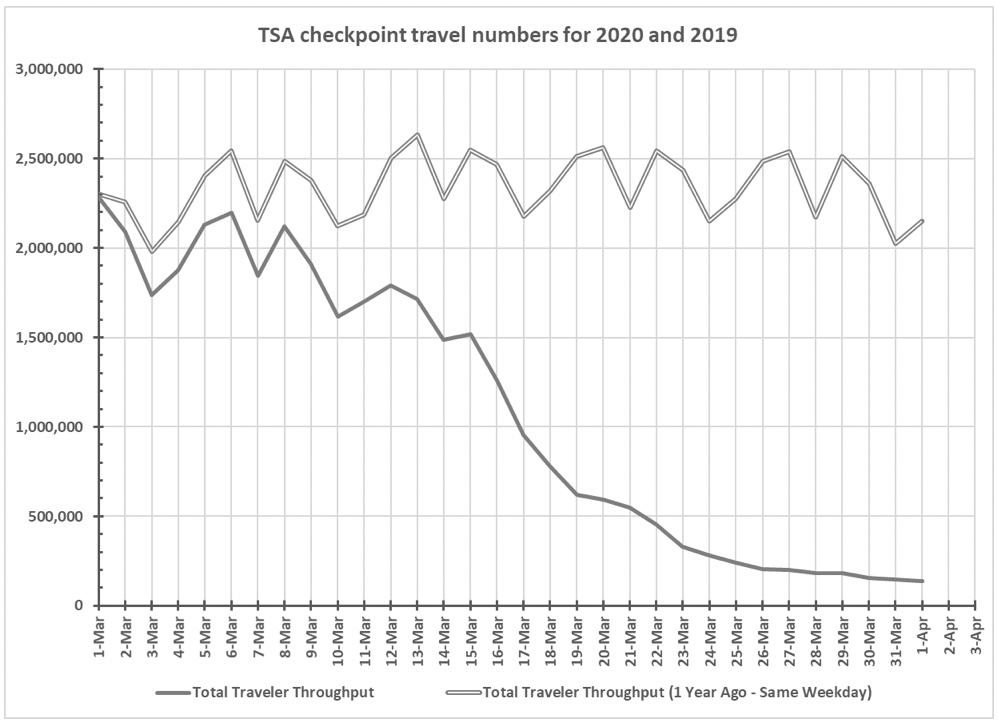
The data displayed in Figure 2 comes from the U.S. Transportation Security Administration. The steep decline in travel displayed here is rather startling. The number of air passengers has fallen to 6% of last year’s level, just 1/16th of 2019!
Transportation Energy
In the transport fuels sector of the economy, sharp declines are also occurring. Figure 3, below, shows the price trend since November for West Texas Intermediate (WTI) crude, the marker for U.S. crude oil prices. As can be seen, the price of WTI has plummeted since mid-February until yesterday when President Trump tweeted about a possible end to the Saudi-Russia crude market share war. That news buoyed the crude oil markets. An agreement by the Saudis and Russians would relieve supply-side pressure that has contributed to the swift drop-off in crude oil prices. (Unfortunately, pressures from demand reduction persist and may very well be deepening.) We will have a better understanding of the situation once we hear official word directly from Saudi and Russian parties.
Figure 3. WTI Crude Price Trend
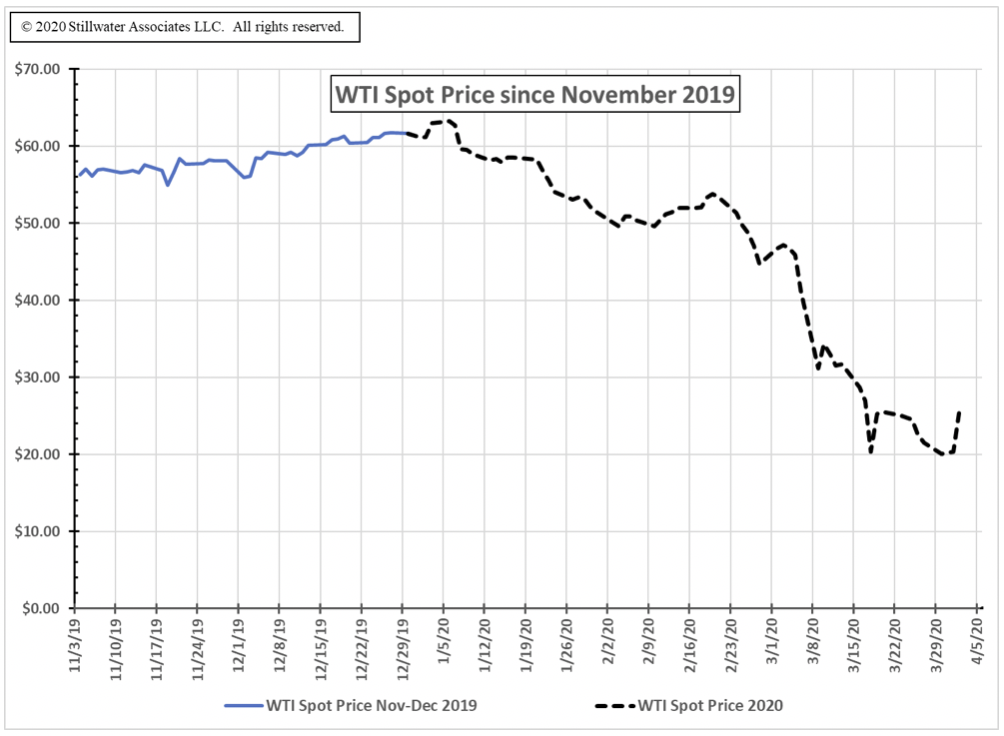
In short, mid-February had WTI crude oil price closing at $52.10 per barrel, the Dow Jones closing at 29,232 and the S&P at 3,370. Yesterday, these values were $25.32, 21,413 and 2,527 respectively. Although we hope otherwise, it’s possible we haven’t yet reached the trough.
Gasoline Stats Start Reflecting What We See Anecdotally
In our last COVID-19 flash report (dated March 20th), we expressed how puzzled we were by recent statistics published by the U.S. Energy Information Administration (EIA) and California Energy Commission (CEC). That data had not shown a downturn in gasoline demand through the week of March 20th even as we heard anecdotal evidence that gasoline and diesel demand had dropped off (i.e. people had cut back significantly on driving due to stay-at-home orders). The lack of statistical evidence may have been due to inventory accumulating in the supply chain past the refineries and bulk terminals or simply a data lag. At any rate, the latest data does show that gasoline has fallen off dramatically nationwide, in Petroleum Administration Defense District (PADD) 5 – which is comprised of the West Coast, Hawaii and Alaska – and in California on a stand-alone basis. The data for the week ending March 27th indicates that U.S. gasoline demand fell by 25%, PADD 5 dropped by 38%, and California declined by 33% from what was the year-to-date average before then. With social distancing and self-isolation orders in place, we expect the data to show additional demand destruction in the coming weeks. The demand trends are shown below in Figure 4.
Figure 4. 2020 Gasoline Apparent Demand – U.S., PADD 5, and California

Low Carbon Fuel Standard
This decline in gasoline demand should significantly reduce the demand for California’s Low Carbon Fuel Standard (LCFS) credits and federal Renewable Identification Numbers (RINs) as well since the petroleum portions of these fuels generate the LCFS deficits that represent the demand for LCFS credits, and generate the renewable volume obligations (RVOs) that represent RINs demand under the federal Renewable Fuel Standard. We discussed how a demand decrease would likely impact these programs in our previous COVID-19 Flash Report.
Two weeks ago, we saw a decline in the price of LCFS credits that coincided with the timing of California’s stay-at-home orders that restricted many business establishments, moved much of the workforce from offices to their homes, and restricted daily activities. All of these restrictions contribute to gasoline demand destruction. On March 19th, in fact, LCFS credit prices fell below $170/MT, a price level not seen since April of 2019. This steep decline in credit price is shown in Figure 5 below.
Figure 5. LCFS Credit Prices for March 2020
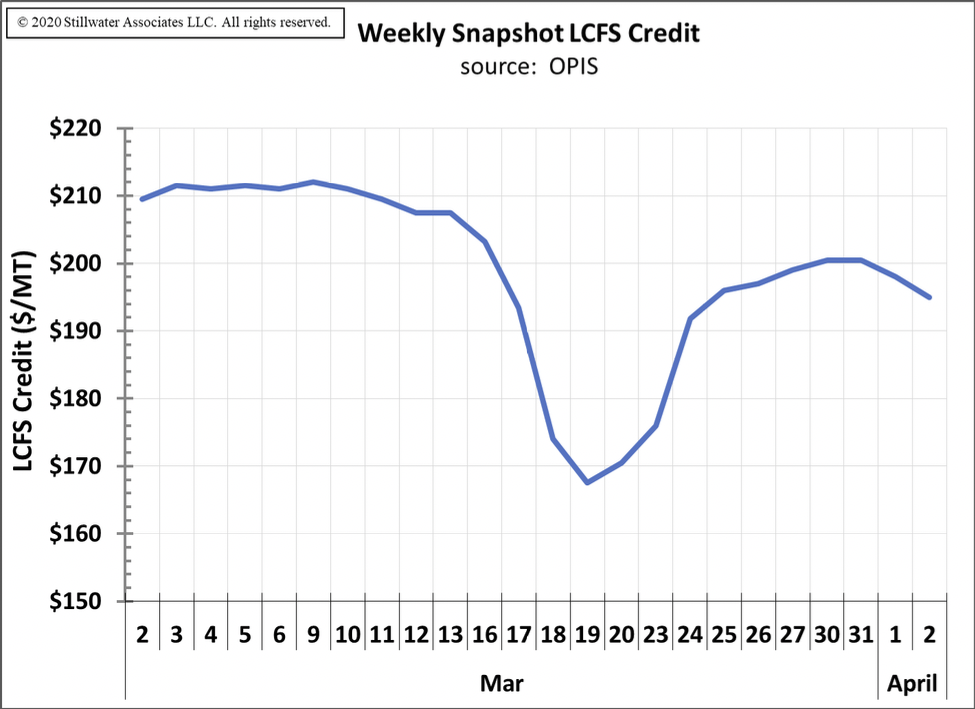
Since March 19th, the price has recovered and settled in at about 90%-95% of its prior level. With hard data available on the gasoline demand destruction, however, refiners may alter their LCFS credit buying and holding targets as their ongoing deficit generation decreases. Any significant changes in entities’ LCFS credit purchase practices would also affect credit prices.
What is hard to predict is how credit generation is responding to lower fuels demand and oil prices. Other than ethanol, which should decline proportional to gasoline, supply of and demand for the other low-CI credit generating fuels will depend on whether they are substitutes for gasoline or diesel. Usage of certain low-CI transportation fuels that substitute for gasoline, like on-road electricity, should decrease for the same reasons that gasoline has decreased – significant decreases in driving due to coronavirus fallout. We have yet to see destruction of diesel demand in the data, so fuels that substitute for diesel – CNG, LNG, renewable diesel and biodiesel – are less likely than gasoline substitutes to see declines in usage at this point. This lack in diesel demand decline is probably due to the reliance of our logistics, services, and delivery systems on these fuels. Therefore, for diesel substitutes, the prospects of “normal” credit generation is possible.
We have entered into a period unlike anything we’ve seen before – a period in which specific analysis is difficult because the data lags behind the rapidly changing global situation. We are continuously monitoring all information available and regularly provide analysis and insight to our subscribers through the LCFS Newsletters and less frequently through complimentary Flash Reports like this one.
Stillwater Associates see things others miss, and we stand ready to partner with you. Contact us for personalized, in-depth analysis around GHG policies and downstream fuels markets.