California’s LCFS is successfully proliferating. Is it also successfully decarbonizing transport?
Link to article: https://stillwaterassociates.com/californias-lcfs-is-successfully-proliferating-is-it-also-successfully-decarbonizing-transport/
July 13, 2021
By Kendra Seymour
As explained in our LCFS 101 Beginner’s Guide and LCFS 101 Update articles, California’s Low Carbon Fuel Standard (LCFS) aims to reduce emissions of greenhouse gasses (GHGs) by reducing the average carbon intensity (CI) of transportation fuels that are used in California. Overall program compliance is generally achieved through the substitution of alternative, low-CI fuels for conventional gasoline and diesel fuels. Within the program, entities that supply low-CI fuels generate credits that are then purchased by entities who generate deficits from producing or supplying high-CI fuels. The LCFS establishes annual CI benchmarks that decrease each year through 2030. The difference between a particular fuel’s CI and the benchmark CI establishes the number of credits or deficits the fuel will generate. Under the LCFS, each fuel is assigned a CI which accounts for the CI contribution from feedstock production, fuel manufacturing, transport to market, and use of the fuel. The current CI reduction schedule steps down from 8.75% reduction in 2021 to 20% reduction by 2030. The standard is currently set to continue at 20% reduction beyond 2030, but the California Air Resources Board (CARB) has begun the process to update and extend the schedule beyond 2030.
So, how successful has California’s LCFS been? The figure below shows the percent reduction in the CI of California’s transportation fuel pool from 2011 through 2020. Through the end of 2020, the program has generated credits representing a total reduction of 77.5 million metric tons (MT) of GHGs alongside deficits totaling 69.4 million MT. That equals an over-compliance of 8.1 million MT, meaning that GHG reductions under this program have been occurring ahead of schedule, as seen by the green line trending below the black line for the first several years of the program. This cumulative over-compliance has resulted in a credit “bank” that creates credit liquidity. In recent years, as CI reduction targets have become more stringent and the standard has become more difficult to meet, the program has begun drawing on credits which were banked in the early years of the program. Accordingly, fuel and vehicle market responses over the next few years will be critical in determining whether the LCFS can stay on track to meet its ambitious long-term objectives.
Figure 1. Performance of California’s LCFS (2011-2020)
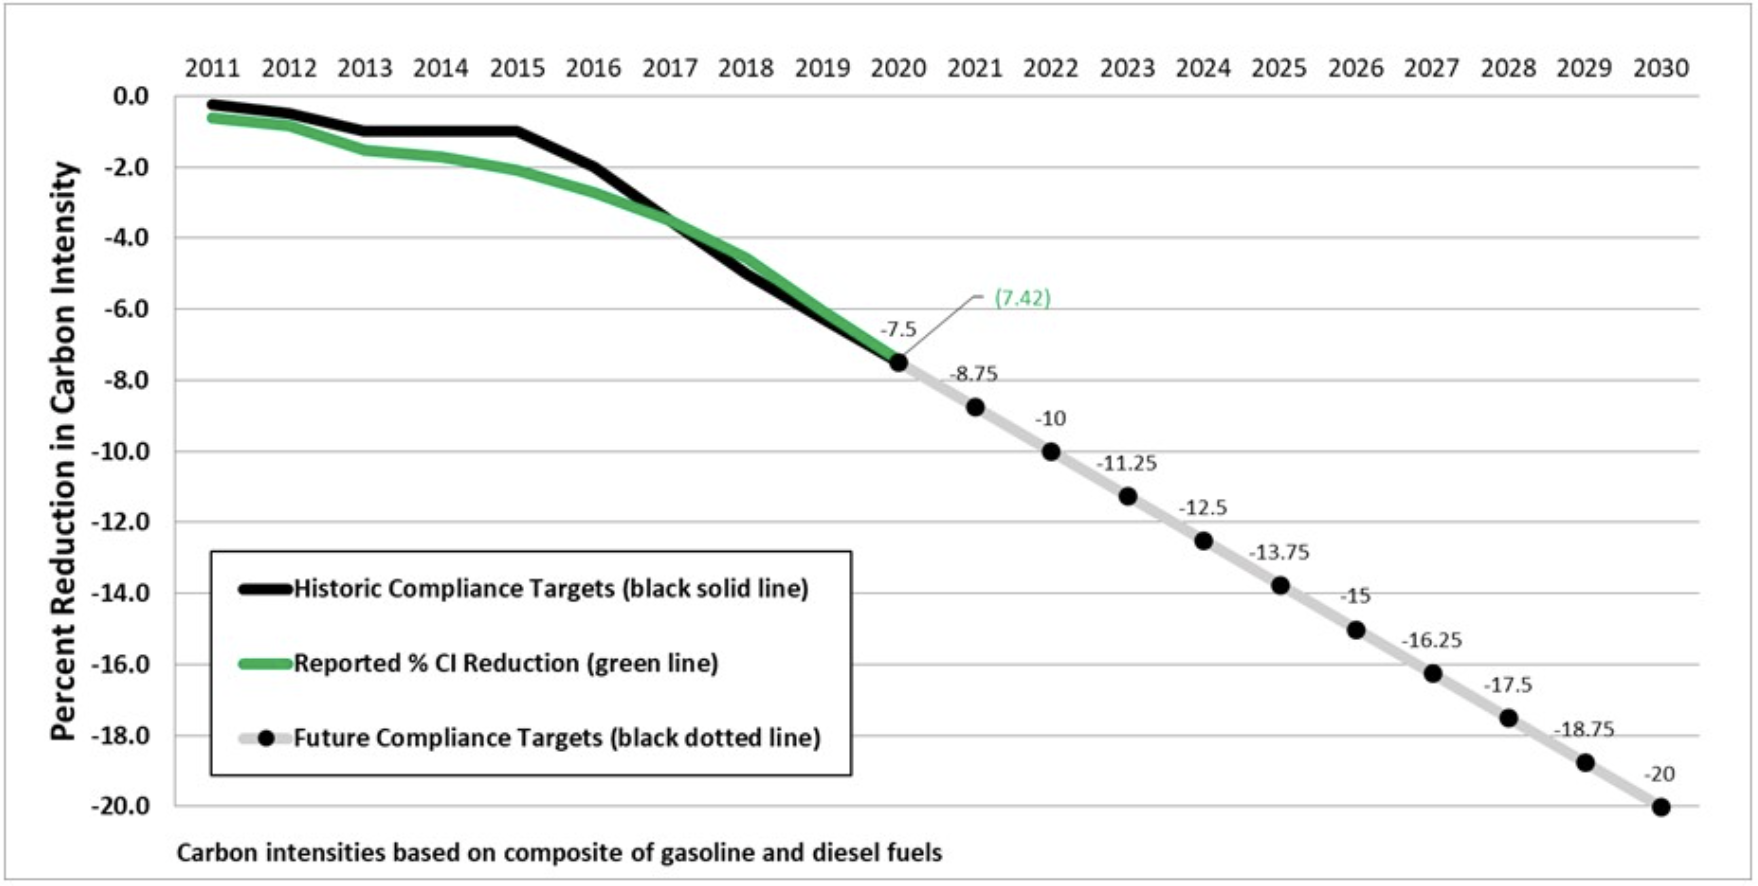
Source: CARB Data Dashboard, updated April 30, 2021
The program has certainly driven the production of an ever-growing volume of lower-carbon transportation fuels marketed to Californians. According to 2020 program data, to date more than 4.5 billion gallons of petroleum diesel have been displaced by low-carbon alternatives like renewable diesel (RD), biodiesel (BD), and renewable natural gas (RNG). In the much larger gasoline pool, more than 45.6 billion gallons of gasoline have been displaced by low-carbon alternatives like ethanol and electricity. Unfortunately, the gasoline pool has proven more difficult to decarbonize, even with LCFS incentives in place, as a drop-in alternative fuel for the gasoline pool (like RD in the diesel pool) has yet to be developed and sales of alternative vehicle technologies like electric vehicles (EVs) and fuel cell vehicles (FCVs) have not reached levels envisioned by some a few years ago.
As with all previous years, the 2020 data shows that fuel producers are in 100 percent compliance with the LCFS, another indicator that the program has met its ambitious goals for reducing carbon emissions.
“Renewable and bio-diesel, renewable natural gas, ethanol, and electricity are all seeing growth under the LCFS,” said CARB Executive officer Richard W. Corey. “Californians have the widest variety of cleaner low-carbon vehicles available anywhere in the country. The LCFS is catalyzing investments in these cleaner alternative fuels, providing consumers with more choices, and reducing emissions of toxic pollutants and greenhouse gases. These are key reasons why other states and nations are establishing similar programs.” Indeed, Oregon adopted its Clean Fuels Program (CFP) just a few years after California enacted the LCFS, and just this year we saw the adoption of a new LCFS-style program in Washington state. Several other states – including New Mexico, New York, and Minnesota – are considering the addition of such programs.
As these programs proliferate, renewable fuels markets will only grow, providing expanding opportunities for low-carbon fuel companies and their investors. California’s LCFS program and the sister programs it has inspired in other jurisdictions have created a complex, interactive matrix of fuel demand, low-CI fuel supply, renewable fuel CI changes, regulatory fiat, vehicle fleet changes, overriding state mandates, commercial arrangements, and competing programs. We foresee this matrix getting more complex in the future. For clients seeking a well-informed, forward-looking view of LCFS credit incentives to guide such investments, Stillwater has developed a unique methodology and database of assumptions, based our deep knowledge of the LCFS program and transportation fuels market, to model a California LCFS outlook through 2031 for our clients based on their specific needs. Unlike a static point-in-time view, our approach creates an active assessment based upon current trends and outlooks, thus accounting for the most recent events and analyses. Stillwater’s model is a powerful tool to help evaluate investment decisions and business strategies, test alternative future scenarios, and to inform decision-making.
Stillwater’s LCFS credit price outlook includes historical LCFS credit balances and prices as a foundation for understanding forward-looking curves. We also present three credit balance and credit price curves through 2031 – our “most likely” curves for both credit balances and credit prices in addition to high and low curves which serve to bound the outlook.
Stillwater’s price projections are based on our analysis of the supply of low-CI fuels in California, the demand for fossil gasoline and diesel, our outlook on carbon intensities of each fuel pool, the evolution of the vehicle fleet, and the ongoing development of the LCFS regulation. Overlaying the numerical analysis is Stillwater’s deep understanding of regulatory actions and the evolution in California, the commercial fuels market, fuels logistics, market structure and players.
Stillwater’s Bespoke, Ten-Year LCFS Credit Balance and Credit Price Outlook includes:
- A table of our annual projected values for LCFS credits.
- Graphs of the supply, demand, and carbon intensity trends that inform our view of the LCFS credit price curve.
- Commentary around CARB’s historic and expected actions to regulate LCFS credit pricing.
- Qualitative descriptions of all key variables and how the data and factors mentioned above influence the forecast.
Stillwater can also run additional scenario investigations utilizing the above-described proprietary model. In this way, Stillwater can evaluate your assumptions and produce unique credit balance and price curves based on these assumptions. Contact us to learn more about Stillwater’s Bespoke LCFS Outlook!
Categories: Economics, News, Policy, Technology Development