California Gasoline Prices
Link to article: https://stillwaterassociates.com/california-gasoline-prices/
May 28, 2019
By Dave Hackett
Stillwater has been writing about California gasoline prices for a long time. Because gasoline prices on the West Coast, and in California in particular, tend to be volatile toward the upside, this issue always gets the attention of consumers and politicians. Our first engagement to look at this subject came from the California Energy Commission (CEC) back in 2001. The CEC had been tasked by the Governor to react to the recommendations of Attorney General Bill Lockyer’s Report on Gasoline Pricing in California.
One of the recommendations from the Attorney General’s report was to consider a Strategic Fuel Reserve – a government-owned gasoline inventory. Stillwater got the work and, as part of the assignment, we talked with many of the market participants and got an insider’s look at the California gasoline issues. Our report described the workings of the California gasoline market from top to bottom.
Our team was not inclined to support government interference with markets, but we decided to figure out if a strategic fuel reserve would work. We came up with a concept where the state would fund a modest amount of inventory that could be auctioned off when market participants couldn’t find normal supplies. Auction winners were obligated to replace the inventory from outside California within a period of time. Our good friend, economist Tony Finizza, Ph.D., wrote a critique of this concept of “time shifting inventory” and thought it would provide a cost-effective solution for short-term supply into the isolated California market at low cost. Unfortunately, our concept was not adopted, but the publicity and analysis did spur terminal companies to build more storage in the San Francisco and Los Angeles markets, helping to provide more inventory capacity.
Since then, Stillwater has worked on projects related to gasoline pricing for the U.S. Energy Information Administration and the State of Hawaii. The objective of the Hawaii project was to review the effectiveness of the Legislature’s gasoline price control law. Our report became the guide to the fuels business in that state. As you might imagine, we concluded that price controls on gasoline were a bad idea and recommended creating processes that improved price transparency.
In California in 2012, gasoline prices were volatile, leading the Governor to create the Petroleum Market Advisory Committee (PMAC) at the CEC. The PMAC was assembled to “help assess petroleum market issues of interest to the Commission.” The volunteer members included energy economists from UC Berkeley, Stanford, and UC Davis, the Assistant Attorney General for Anti-Trust, and me. The Committee met from 2014 to 2016 and looked at the extreme volatility that occurred in 2015 after the explosion as the ExxonMobil Torrance refinery in the Los Angeles area. The PMAC was disbanded due to insufficient resources to correctly get into the analysis required to meet its charter. The final PMAC report is posted here.
Now, in 2019, gasoline prices are once again volatile and high. There are two related issues: high prices in the spot market and sustained high prices in the retail sector. In this article we’ll discuss the former. Next time, we’ll get into the Mystery Gasoline Surcharge (MGS) about which my PMAC colleague, Severin Borenstein, has been writing.
The spot market is the point at which gasoline first trades, often referred to as the “refinery gate price.” The volume is typically 25,000 barrels, a bit more than a million gallons, and the delivery is into a pipeline for movement downstream of a refinery or import facility to a terminal that loads trucks for gas stations. The spot market gets high and volatile when there is an unexpected loss of gasoline production, generally because one or more refineries go offline due to unscheduled maintenance. When a refinery goes down for scheduled maintenance, they always have a plan to cover their contractual obligations by building inventories and obtaining supplies from other refineries.
The spot market is an unregulated, over-the-counter market. The participants are refiners, traders, marketers, and brokers, and the transactions in the market are reported to pricing services like OPIS, Platts, and Argus.
Since the start of the year, there has been a lot of refinery maintenance, both planned and unplanned, in the refining centers in California and Washington. Gasoline production has been low, but cargos of gasoline have been coming in from around the world. Unfortunately, it takes at least four weeks to get a cargo of California-spec gasoline made in a refinery in India or Europe and sail it to Los Angeles.
Economists use supply and demand curves to help describe what happens with prices when the market changes. In their simplest form, these curves assume demand is high when prices are low and demand declines as prices increase. Similarly, supply is low at low prices and high when prices increase. UC Irvine Professor Richard McKenzie offers a nice illustration and explanation of this concept in this video.
In his paper on the SFR, Dr. Finizza explained that for the short-term gasoline market in California, the demand curve is highly inelastic – consumers don’t quickly change their gasoline consumption when prices change. Also, the supply curve is flat (elastic) for production up to a point close to full refinery capacity utilization.
Figure 1. Short-Term Gasoline Supply and Demand without SFR
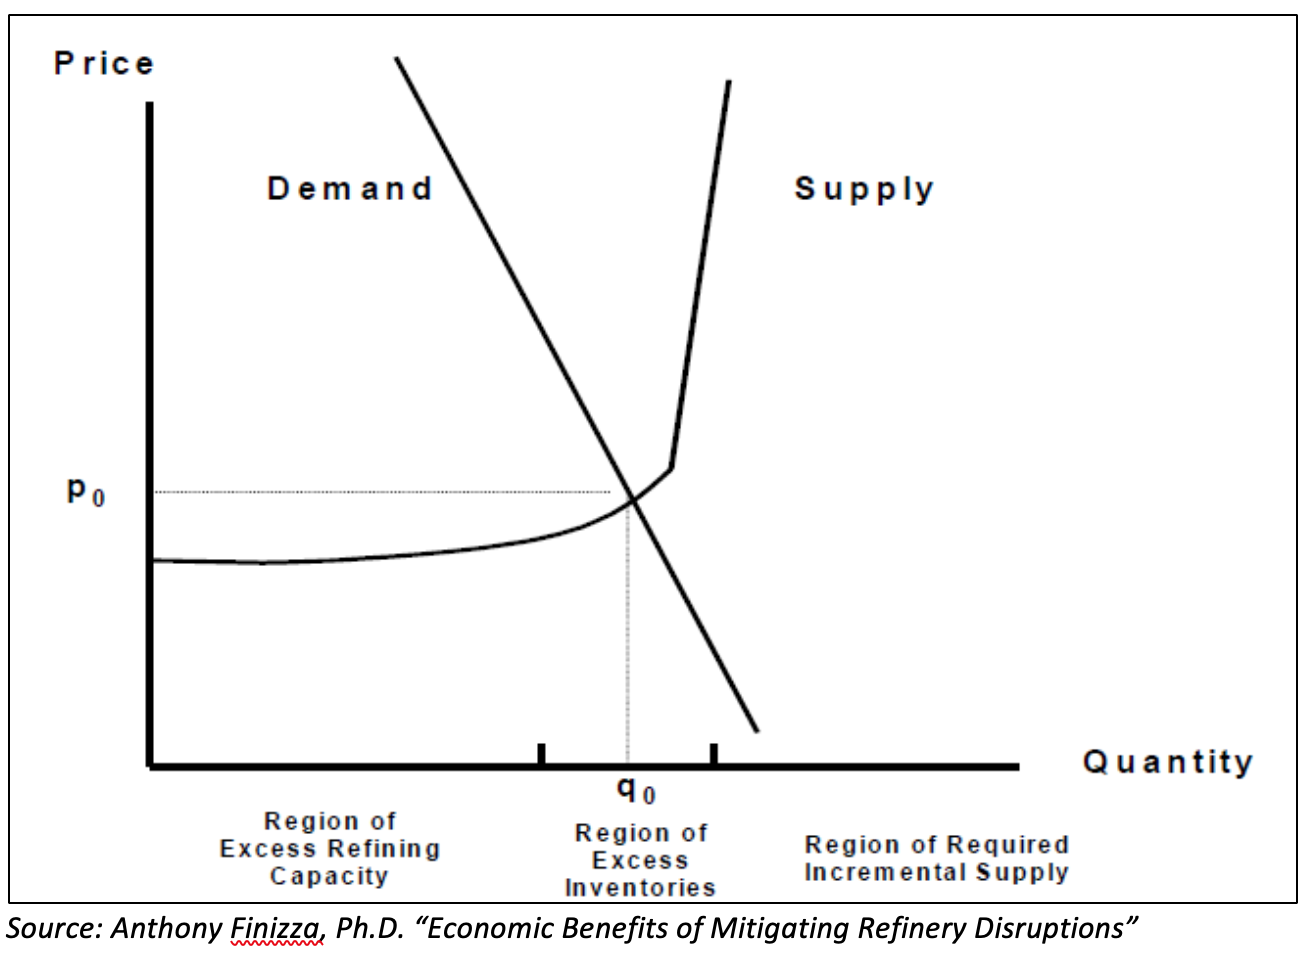
Dr. Finizza illustrated three regions. In the first, there is excess refinery capacity, and the refineries can make more California gasoline than is demanded. The second is where inventories have been built up, and the third is where excess refinery capacity and excess inventories have been consumed. At that point, the supply becomes inelastic and prices rise sharply.
The impact on the spot market can be seen in the chart below which plots the difference between the spot market in Los Angeles and the New York Mercantile Exchange. This view eliminates the impact of crude oil prices on the analysis.
Figure 2. Prompt LA Spot CARBOB Regular vs. NYMEX Regular
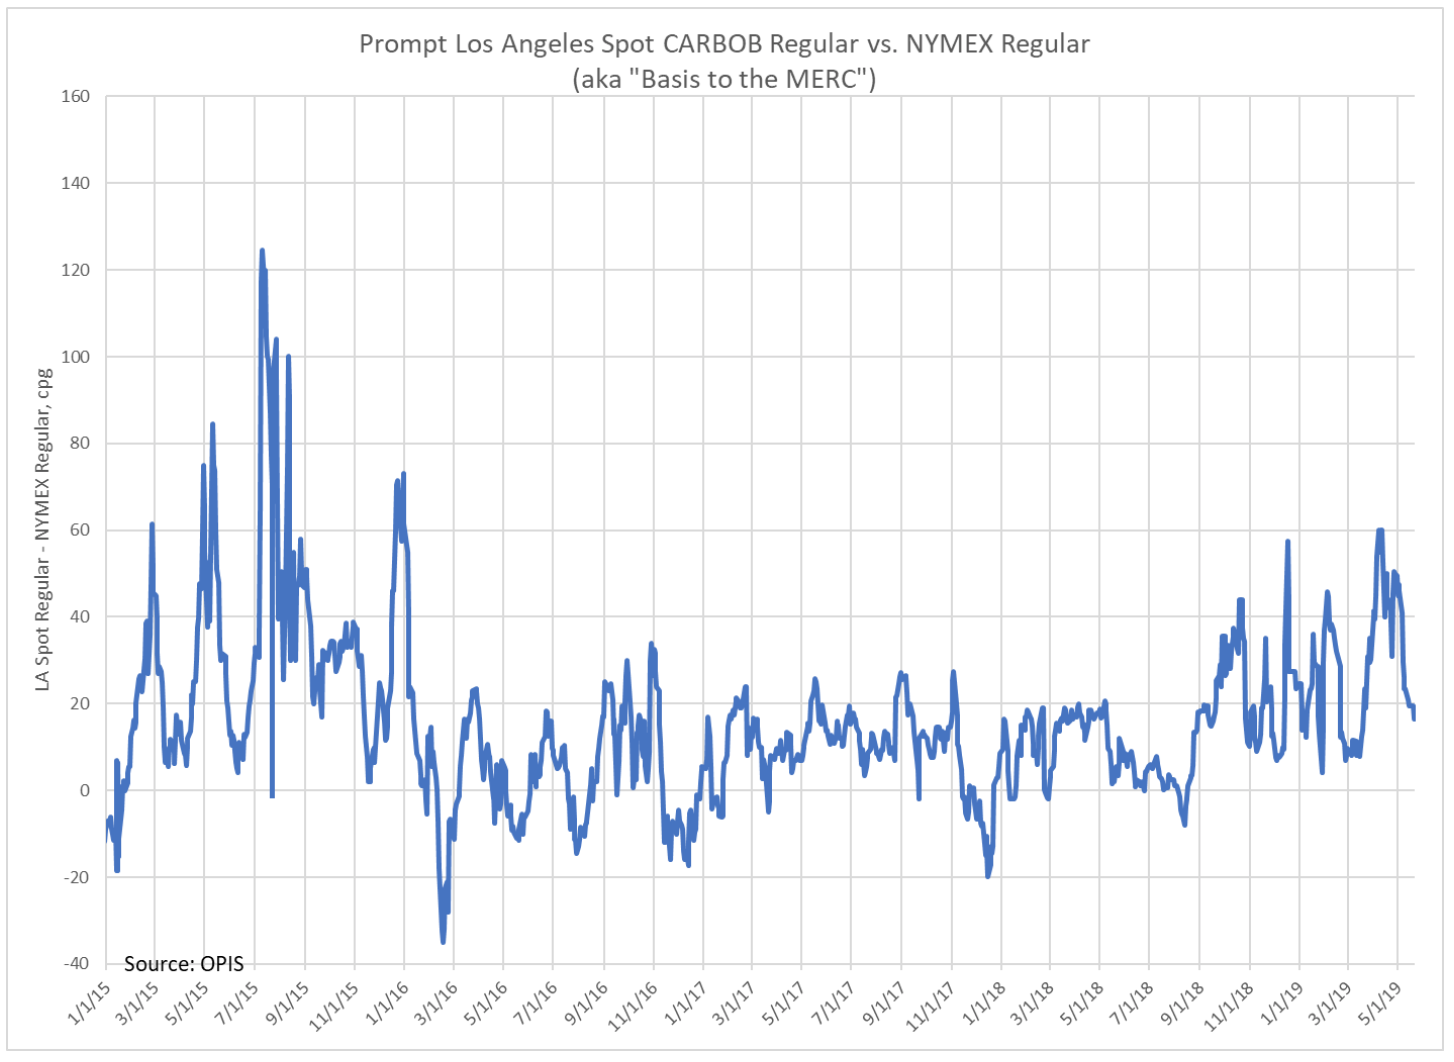
This chart shows how highly volatile 2015 was, and now a somewhat volatile 2019. We expect the refineries will complete their maintenance as imports continue to arrive, which will move the supply back into the “Region of Excess Capacity”. This will reduce spot prices and volatility, and eventually lead to lower prices at the gas station.
Tags: gas pricesCategories: Economics, Wisdom from the Downstream Wizard