California Carbon Info: Analyzing California’s offset demand
Link to article: https://stillwaterassociates.com/california-carbon-info-analyzing-californias-offset-demand/
As the passage of AB 398 has strengthened and extended California’s Cap and Trade program, we think our readers will benefit from a spotlight on the trends in the carbon credit market. Starting this month, we will be featuring guest articles on California’s Cap and Trade program from our friends at CaliforniaCarbon.info. CaliforniaCarbon.info is a comprehensive information service covering the Western Climate Initiative (WCI) carbon market in North America. CaliforniaCarbon.info provides emissions and price forecasts, and regular analysis of the allowance and offset market. We are excited to feature their expert analysis on California’s Cap and Trade program and the forces that impact the carbon credit market. Look for regular articles from Stillwater’s LCFS Newsletter featured at CaliforniaCarbon.info.

August 29, 2017
By Billy Hamshaw – [email protected]
The results of this month’s quarterly carbon auction spelt good news for California’s carbon allowance (CCA) market. A full turn-out and historical clearing price of USD 14.75 propelled CCA prices on an upward trajectory, gaining USD 0.46 from pre-auction results to last week’s close of USD 15.16 on the secondary market. The results demonstrate that California and Quebec’s landmark emissions trading scheme is on as solid footing as ever, with participants confident about the program’s future.
With cap-and-trade policy set in stone through to 2030 and the program ring-fenced from future legal challenges, allowance prices will now be dependent upon supply and demand dynamics and therefore emission projections over the coming years. Adjustments to the provision of offsets in the new bill, however, cast new uncertainty over the future supply and demand balance of California’s carbon offset market.
As of 2025, offsets will be capped at 4% of an entities compliance obligation, increasing to 6% from 2026 to 2030 with a maximum limit of 50% from projects that do not directly benefit Californians. While the provisions have been designed to prioritize emission reductions within the state, some market proponents believe that the new uncertainties over the future supply and demand balance will cause unnecessary disruptions to an already flourishing market.
Preliminary analysis undertaken by CaliforniaCarbon.info in collaboration with the American Carbon Registry suggested that around 12 million CCOs will come online between 2020-2030 based on recurring reporting periods from credited, registered and listed forestry and livestock projects within California. This would fulfill only 0.4% of the projected demand, a far-cry from the 2% and 3% eligible under the new legislation. The restricted supply of Californian offsets may, however, spur participants to hedge on future CCO prices, carrying offsets issued in previous vintages forward for future compliance obligations or selling when in higher demand.
Near-term supply of Californian offsets
To date California has accounted for 24% of the total volume of offsets generated. Data released by ARB in December last year showed that 2 million offsets surrendered in 2015’s annual surrender were from Californian based projects, 12% of the current in-state CCO supply. Including those surrendered in 2013 & 2014’s and excluding those kept in a buffer pool for insurance purposes, 10.9 million Californian offsets remain eligible for compliance. A further 4 million registry credits (ROCs) are currently pending issuance whilst a large backlog of forestry projects listed prior to protocol changes in 2015 also exist.
Based on statistical analysis of credit volume from acreage size, CaliforniaCarbon.info has estimated that the backlog of Californian forestry projects listed could yield an additional 20 million carbon offsets from first round reporting periods. With the deadline for projects listed prior to the protocol changes in 2015 fast approaching, it seems unlikely that all of these projects will progress however. Even if a more conservative 50% of the forestry projects listed come to fruition, a total of 25 million Californian offsets could hypothetically boost supply in the near term and be carried through to compliance obligations post-2020.
Utilization uncertainty
Assumptions based on low utilization rates have led some market analysts to conclude that only a handful of new projects would need to be developed to meet the future demand of Californian based offsets. Uncertainty over the true utilization of offsets under the new legislative provisions now represents the greatest barrier to project investments.
Historically an average offset usage of 4.5% has been observed amongst entities operating within the WCI carbon market. Larger emitting entities tend to utilize their full quotas with greater rewards to be reaped from surrendering larger volumes of the lower cost compliance instrument. Transaction and administration costs, invalidation risks and procurement constraints have discouraged lower emitting agents from fulfilling the same level of offset limits.
2015 compliance stats
Data from ARB’s 2015 compliance report revealed that 7.9% of all instruments surrendered under the first annual compliance obligation of Compliance Period 2 were offsets. Under 2015’s compliance obligations, entities were obliged to surrender only 30% of their 2015 annual obligation. 30% of their 2016 budget will be required to be surrendered this December whilst the largest surrender will come in 2018 when entities will be obliged to submit 70% of 2015’s total instruments, 70% of 2016s and 100% of 2017.
2015’s compliance data revealed that 19 entities decided to maximize their yearly budget with an 8% offset usage, surrendering 26.7% of the 2015’s 30% compliance obligation with offsets. On the other hand, 230 entities chose not relinquish any offsets, opting to either surrender them in future compliance obligations or not at all.
Table 1. 2015 compliance data by offset volume
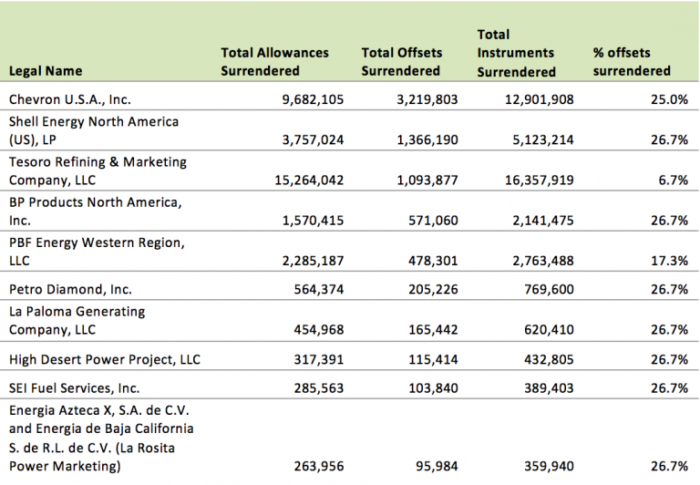
Given the disparity between the surrendering behavior of entities, it is difficult to draw any meaningful conclusions from the 7.9% offset usage observed in 2015’s compliance data. One thing that is for sure, however, is that as CCA prices rise, maximizing offset limits will play an increasingly important role in reducing overall compliance costs. With greater savings to be made we can expect to see offset usages rise from the historical average of 4.5% with smaller entities being drawn in by the benefits of the offset program.
Foreign demand for out-of-state offsets
Whilst Ontario’s Ministry of the Environment and Climate Change (MOECC) are working closely with the Climate Action Reserve (CAR) to adapt existing protocols suitable for the compliance market, little volume is expected to be generated from the province in the near term. Quebec’s total offset pool to date represents only a fraction of that of California too, Both Canadian partners are therefore expected to be net buyers of US offsets.
Without a mature offset market it seems unlikely Ontario and Quebec will follow suit and adopt the same domestic mandates as California unless a pre-requisite for linkage. Ontario has in the past advocated for higher offset usages, allowing entities a lower cost pathway for compliance as well as increasing emission savings from non-capped sources. An 8% offset usage is widely expected to continue through to 2030, therefore.
Based on CaliforniaCarbon.info emission projections, an annual maximum demand of around 10 million offsets would exist under a full 8% usage by Ontario entities. Given the disposition of fewer large scale entities than California as well as additional risks such as foreign exchange risks, invalidation risks and pressures to localize emission savings, CaliforniaCarbon.info has estimated a more conservative utilization rate of 2-3%, representing an overall demand of around 30 million from 2021-2030. These rates would still provide healthy demand for offsets generated outside of California.
A full breakdown of CC.info’s Offset Compliance Inventories is available on request for all DataSmart and Pricing & Forecast subscribers. The excel sheets provide a comprehensive analysis of offsets surrendered on an entity by entity basis and complete project inventories. They include updated data from 2013, 2014 and 2015. To request access or for more information, please contact [email protected]

Offset Compliance Inventory Sample
Categories: Economics, News, Policy, Technology Development, White Papers