Bubble Map Update: Crumbling Crude Prices Flip Logistics
Link to article: https://stillwaterassociates.com/bubble-map-update/
January 18, 2016
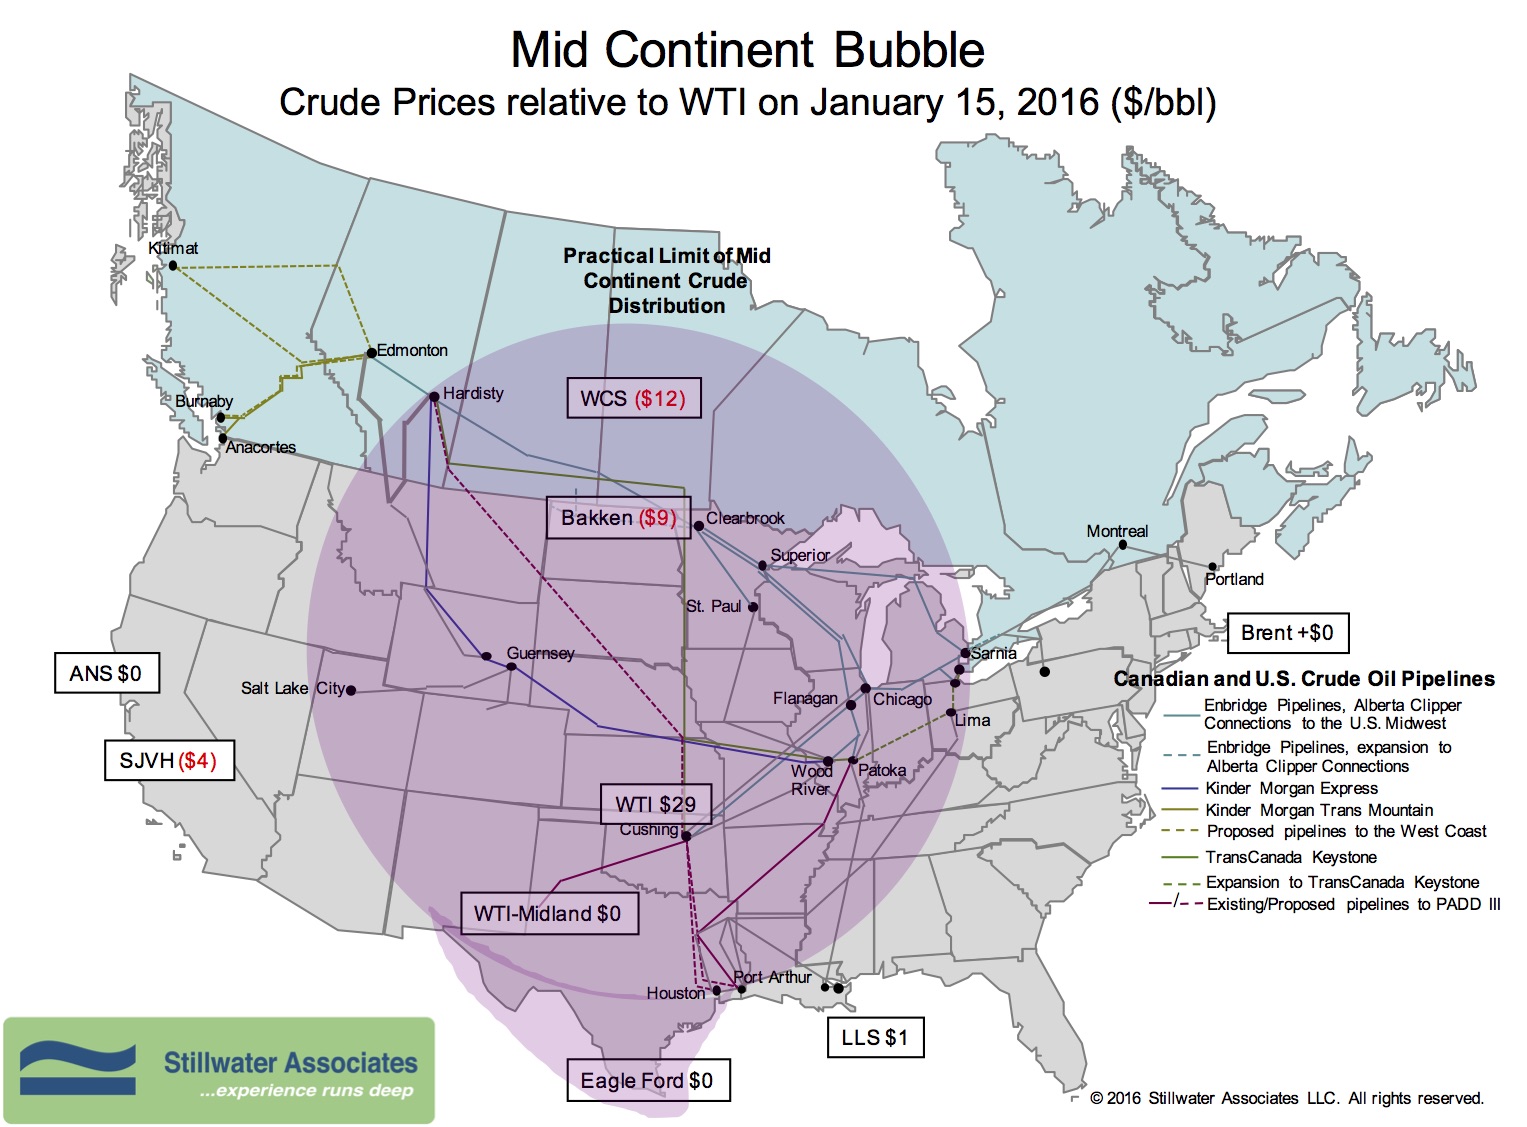
The first Bubble Map of 2016 shows crude oil prices continuing to fall. Prices on January 15th have WTI dropping from $37 to $29 since our last blog in December. The Brent price has also dropped to $29, driving the Brent differential just cents under WTI. The Western Canadian Select discount has narrowed slightly to $12 under WTI. On the Gulf Coast, crude oil from shale formations in Texas like Eagle Ford were priced at parity with WTI, and Louisiana Light Sweet was at a little more than $1 over WTI. On the West Coast, the Alaska North Slope differential remains at just cents over WTI. The San Joaquin Heavy discount tightened to $4 under WTI on January 15th.
Back in 2012 when we started using the Bubble Map to illustrate the huge discounts on crude oil in the Mid Continent, WTI was around $90 per barrel and the WCS differential was as wide as $28 under WTI. Moving crude oil out of the Bubble by expensive rail or barge to refining centers on the coasts became an economic option. Whole business models have been built around the Mid Continent oil boom and the logistics set up to support it. Four years later in 2016 the logistics game has been turned on its ear. WTI is unlikely to hold $29 and is headed lower. We forecast that if WTI does not hold at $25, it could drop as low as $18 this year. The methods of transporting crude oil out of the Bubble, trains and tankers, are too expensive to compete in the current marketplace. Production in the tight oil regions has slowed, but not fast enough to end the glut. These changes in the market will create idle rail and tanker capacity.
Tags: WisdomCategories: Wisdom from the Downstream Wizard