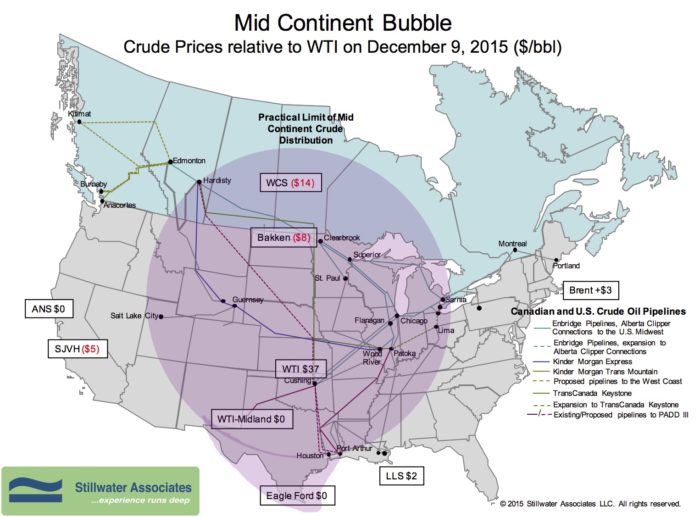
Bubble Map Update: Drop in Oil Prices Takes the Steam out of the Mid Continent
Link to article: https://stillwaterassociates.com/bubble-map-update-drop-in-oil-prices-takes-the-steam-out-of-the-mid-continent/
December 10, 2015

The December Bubble Map shows crude oil prices dropping overall while differentials to WTI have remained relatively stable. Prices on December 9th show WTI dropping from $46 to $37 since our last blog in October. The WTI/Brent differential has widened slightly at $3 over WTI. The Bakken discount has widened to $8 under WTI. The Western Canadian Select discount has narrowed slightly to $14 under WTI. On the Gulf Coast, crude oil from the shale formations in Texas like Eagle Ford were priced at parity with WTI and Louisiana Light Sweet was $2 over WTI. On the West Coast, the Alaska North Slope differential was just cents over WTI. The San Joaquin Heavy discount remained at $5 under WTI on December 9th.
The drop in crude oil prices has slowed production activity. According to the EIA, total U.S. crude oil production started to decline in May and is expected to continue to decline through September 2016. The latest Short Term Energy Outlook forecasts total U.S. production to average 8.5 million barrels per day (mbd) by September 2016, down from a 9.4 mbd average for the first three quarters of 2015. As production has slowed, so has crude-by-rail (CBR) traffic. CBR carloads have fallen 30% since its high in December 2014. Sending the last barrel of Mid Continent crude oil to market by rail is no longer economic.
Tags: WisdomCategories: Economics, Wisdom from the Downstream Wizard
