Bubble Map Update: Crude Prices Up Slightly as Production Slows
Link to article: https://stillwaterassociates.com/bubble-map-update-crude-prices-up-slightly-as-production-slows/
April 15, 2015
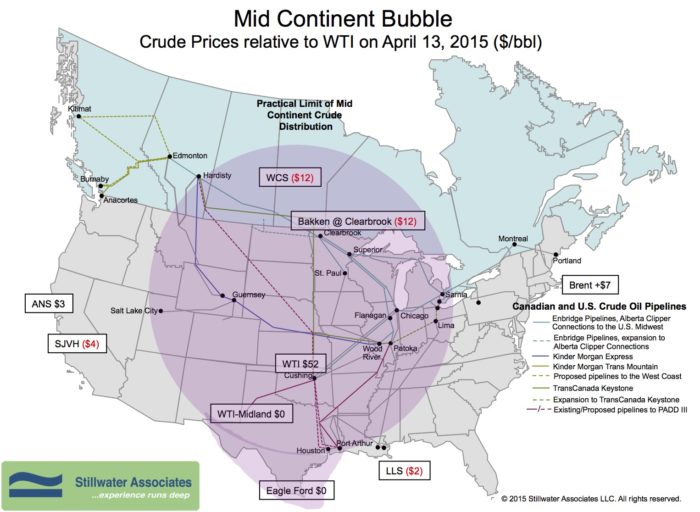
The April Bubble Map finds crude oil prices on a slight uptick. WTI broke the $50 threshold and was priced at $52 per barrel on April 13th. The WTI/Brent differential has tightened to $7 over WTI. The Alaska North Slope price has gone up, rising to $3 over WTI. Alaska’s Dalton Highway, the lone road leading to North Slope Oilfields, has been closed recently due to flooding. This has slowed production and may explain the ANS price movement. Western Canadian Select and Bakken are discounted at $12 under WTI.
Prices have risen on the signal that crude oil production in the Mid Continent is starting to slow down. The EIA is reporting in this month’s Short Term Energy Outlook (STEO) that the oil-directed rig count has declined to the lowest level in more than four years. U.S. shale production is expected to fall by 45 thousand barrels per day (kbd) in May.
As crude oil prices slowly start to rise, so do gasoline prices. We have already seen the bottom of the pump price bonanza, but summer gasoline prices will still be the lowest they have been since 2009. The STEO forecasts the national average price for gasoline this summer will be $2.45 per gallon. Last year the national average for the same period was $3.59. Based on the EIA’s forecast, the average U.S. household is expected to spend $700 less on gasoline in 2015 than they did in the previous year.
Tags: WisdomCategories: Wisdom from the Downstream Wizard