April Bubble Map: Eased Up Price Differentials in the Mid Continent
Link to article: https://stillwaterassociates.com/april-bubble-map-eased-up-price-differentials-in-the-mid-continent/
April 8, 2013
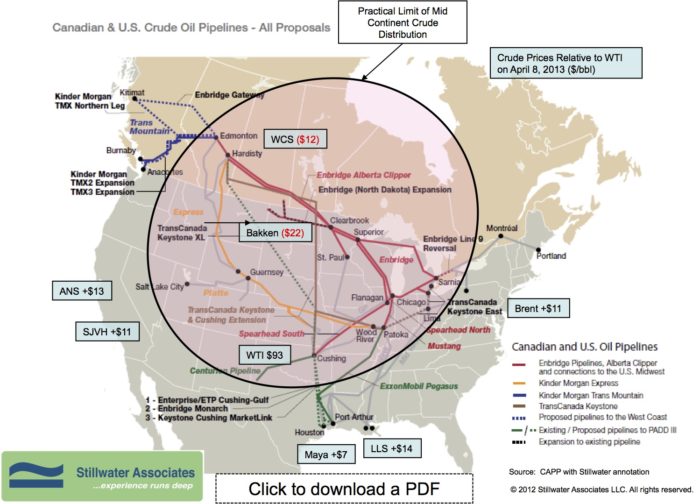
The April edition of the Bubble Map shows that Mid Continent price differentials to the coast have gone down since our last update in January when Brent was $18 over WTI. The WTI/WCS differential is the narrowest since last October. WCS prices generally strengthen in spring because the start of the paving season improves demand for asphalt. The slow start up of Imperial Oil’s Kearl Oil Sands Project is keeping anticipated volumes out of the market, leading to a stronger price for WCS. So far the price does not seem to be effected by the Pegasus pipeline spill, but we will continue to monitor the situation.
Bakken shown on the map at the well-head is $22 under WTI. Once Bakken reaches the Enbridge pipeline at Clearbrook, MN the price gets closer to WTI at $1.50 under. The relationship between WTI and Bakken continues to evolve as more rail capacity becomes available. According to the EIA’s This Week in Petroleum, Bakken production rose 58 percent in 2012 to 663,000 bbl/d, while pipeline capacity in the region, which also carries Canadian crude oil, was estimated at 395,000 bbl/d in 2012. Trains and trucks are delivering the excess, cost competitive, barrels to refineries on the East and West Coasts.
Tags: WisdomCategories: Wisdom from the Downstream Wizard